FIGURE 1: S&P 500. Note that the index is well above its
50-day moving average -- would you go long or short?
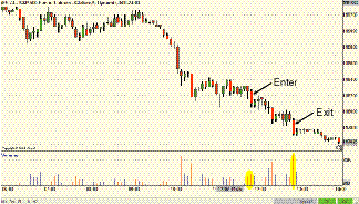
I entered the position at 11:55 and it got filled at 1182.00. If you look at the five-minute chart of the emini in Figure 2, you'll notice that since around 10:00 am prices were showing a rather strong downward movement with firm resistance at the 1184 level and support at 1182. When I noticed that momentum was moving strongly and price seemed determined to break below the support level at 1182, I decided to enter a short position. This happened at around 11:55 am.

Figure 2: five-MINUTE CHART OF THE E-MINIS. This was a fortunate
move in prices in the desired direction.
You can see from the chart that I could have made my two points by 12:25 pm when prices hit 1180, but judging by the momentum at the time, it seemed like a good idea to hold on a little longer. Still, I wondered why I was staying in the trade. In fact, when I saw that prices were hovering around the 1180 level, I did think about exiting, but because of some distraction I lost my focus. When I turned back to the screen I noticed that at 12:50 there was a slight increase in selling enthusiasm, so at 12:55 when that enthusiasm increased again, I exited my position at 1179. So I ended up with a three-point profit -- minus commissions and slippage -- on a trade that was made on gut instinct. I just followed the crowd.
Placing trades like this can be fun because you really get a feel for what is going on in the market. If there's a crowd of people rushing to sell or buy, you can recognize it just by watching price and volume. The challenge is to determine how long a certain move will last, and that is where technical analysis comes into play. When you see that movement in an intraday chart, it's actually a good time to plug in an indicator and measure its performance. Does it trigger an entry signal? Does it tell you to exit your position at a reasonable time? I have found that the best way to begin creating a trading system is to analyze indicators in real time. Suppose prices dropped sharply within a minute. Did the indicators you applied indicate that price drop? If they didn't, then it's probably time to consider other indicators to see which ones came closer to forecasting. And once you do find some that work well, it doesn't necessarily mean they'll continue working well in all types of markets. It takes a lot of patience and hard work to come up with a system that works in all markets. The time has come for me to sit down in front of my screen and try to create a more effective trading system. It just goes to show that your trading strategies need to be constantly revised to accommodate the market's changing behavior. So it is possible that I may describe a different trading strategy in my next column.
--Jayanthi Gopalakrishnan, Editor
Originally published in the February 2005 issue of Technical Analysis of STOCKS & COMMODITIES magazine. All rights reserved. © Copyright 2005, Technical Analysis, Inc.
Return to February 2005 Contents