I Remember VOMOMA
Adding Volume To The Move-Adjusted Moving Average
by Stephan Bisse
In this second article of the series, we look at how adding volume can help identify large moves in one direction.
In "Visiting MOMA," my previous Technical Analysis of STOCKS & COMMODITIES article, a simple moving average (SMA) was adjusted by the relative magnitude of the change between closes to create a move-adjusted moving average (MOMA). The reasoning behind this adjustment was that moving averages on their own can, by definition, never say anything about the future direction of a time series, only give a view of where a time series has been. This holds true regardless of the lookback period used or any weightings applied to the datapoints, be it a linear weighting such as in a weighted moving average (WMA) or an exponential moving average (EMA), which uses an exponent to determine the rate at which the significance of older datapoint decays. It is no coincidence that moving averages often form the basis of trend-following trading systems.
FUTURE DIRECTION
Logically, the only way that a moving average can act as a predictor of the prices is if additional information is incorporated into the calculation. This additional information has to be some sort of leading indicator for the time series in question.
Two well-known variations on moving averages already introduce additional information into the calculation: the volatility index dynamic average (VIDYA) developed by Tushar Chande and the volume-adjusted moving average (VAMA) developed by Richard Arms. The VIDYA uses a volatility index for weighting the datapoints, while the VAMA weights the datapoints in the lookback period based on their corresponding relative volume.
In both moving averages the adjustment is done primarily to improve their responsiveness in times of heightened volatility or increased volume with the aim of cutting down on lag. However, if either volatility or volume is a leading indicator, then in theory VIDYA or VAMA can have predictive power and go beyond showing where a time series has been.

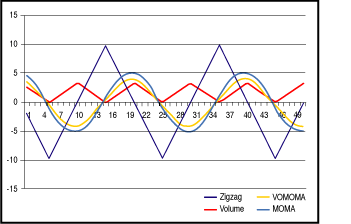
FIGURE 1: VOMOMA VS. MOMA. VOMOMA turns up before MOMA after a trough and turns down before MOMA after a peak. VOMOMA smoothes out the data better than MOMA or the simple moving average.
Excerpted from an article originally published in the March 2005 issue of Technical Analysis of STOCKS & COMMODITIES magazine. All rights reserved. © Copyright 2005, Technical Analysis, Inc.
Return to March 2005 Contents