Testing, Testing One Two Three
Backtesting And Edgetesting
Anybody with a computer and an Internet connection can evaluate trading strategies. But how do you judge the validity and significance of the results? Here's a look at some of the pitfalls awaiting the unwary.
The age of program trading for the masses has arrived. Backtesting - the evaluation of strategies against reams of historical data - is easy to do, but useful, trustworthy advice on the validity and significance of backtesting results remains in relatively short supply. In this article I will walk you through the design process of a simple strategy, and leave it up to you to determine validity and significance.
THE FIRST STEP
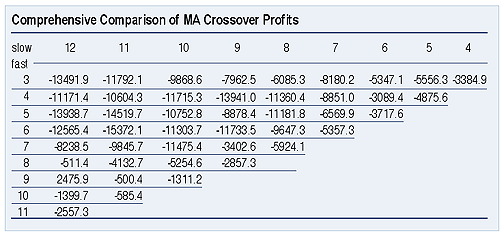
Most backtesters begin with whole-sample testing. Applying a strategy against a large, contiguous mass of data can give you a quick estimation of what has worked in the past. For example, a simple moving average crossover signal tested against 80 years of historical Dow Jones Industrial Average (DJIA) data shows a 5/8 crossover on daily bars produced a loss of 11,000 points. There is no reason to stop there: Because of the availability of data, it is possible to test several parameters. In Figure 1, you see the results of expanding the test to cover all possible moving average crossover combinations between three and 12.

FIGURE 1: COMPARISON OF MOVING AVERAGE CROSSOVER PROFITS. Here you see the results of expanding the test to cover all possible moving average crossover combinations between three and 12.
It appears that a 9/12 crossover is far more promising than the 5/8, with a gain of nearly 2,500 points. That's a 9,000-point swing! But before trading this pattern, another test is in order. Instead of testing against all 80 years of Dow data at once, I have broken up the data into 10 equal-sized portions, and tested the crossover signal against each data slice individually. The results are displayed in Figure 2, and a problem is immediately apparent.
Although on a larger scale the 9/12 moving average crossover approach looked promising, the finer resolution (Figure 2) indicates that virtually all gains were concentrated in one small segment of time. In fact, over the first 80% of the bars, the strategy was a net loser. This is one of the problems with whole-sample testing: It tells you nothing about the distribution of the gains. And since most traders prefer strategies that provide consistent returns, the distribution of gains is very important.
Out-of-sample (OOS) testing attempts to fix this problem. Broadly speaking, OOS breaks the available data into sections, using some for development and others for testing. With the example I've given, the original strategy search might be performed on sections A and D with the other sections reserved for testing the fine-tuned version.
...Continued in the March issue of Technical Analysis of STOCKS & COMMODITIES
Excerpted from an article originally published in the March 2005 issue of Technical Analysis of STOCKS & COMMODITIES magazine. All rights reserved. © Copyright 2005, Technical Analysis, Inc.
Return to March 2005 Contents