Variables That Influence Pattern Performance
What Powers Chart Patterns?
Have you ever wondered if small-cap stocks perform better than large caps? Does heavy breakout day volume really power prices higher? Here's a closer look at variables that affect chart pattern performance.
"What powers stocks?" If you asked me that 25 years ago when I first started investing, I would have rattled off a bunch of fundamental factors such as good earnings, strong sales, little or no debt, insider buying and no selling, not to mention the ratios: price to earnings, price to sales, debt to equity, and so on. Since I defected from the fundamental side to technical analysis, the question becomes, "What powers chart patterns?" My answer today is shorter: supply and demand. If no one wants to sell Google and everyone is clamoring for the shares, the stock will rise. If research becomes public saying that a drug kills people, investors will dump the shares of the company that makes it, and the stock will tumble. Quickly.
This article discusses results of research I conducted on nearly 7,500 chart pattern samples in 13 bullish and 13 bearish chart pattern types during the writing of my book, Trading Classic Chart Patterns. The research includes the years from 1991 to 2001, but not all 500-plus stocks covering the period. I've found the answers to certain questions about what affects chart patterns.
PRICE TREND
What length of price trend leading to a chart pattern results in the best post-breakout performance? Answer: the short term. For chart patterns with upward breakouts, a price trend of less than three months' duration leading to the start of a chart pattern yielded the best performance eight times. The intermediate term (three to six months long) worked best twice and the remaining four times did well for trends longer than six months, including one tie. For downward breakouts (bearish patterns), the short term worked best nine times, and the intermediate did best four times. None of the long-term trends performed well.
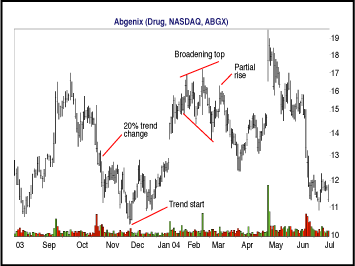
As an example, Figure 1 shows where I located the trend start in a broadening top. I began from the beginning of the pattern and looked back, searching for a trend change that will mark the trend start. Since price enters the pattern from the bottom, I am looking for the lowest low before prices close 20% higher, working backward. For prices entering the chart pattern from the top, look for a 20% trend change from highest high to closing low, working back in time.

FIGURE 1: THE TREND START. The trend start appears at the bottom of a downward price trend. A partial rise appears in a broadening top.
In this example, the low is at 10.41 so a close 20% higher is 12.49. That occurs in mid-October. The distance between the trend start and the formation start is the length of the trend leading to the chart pattern. In this example, the trend duration is short term (less than three months).
This broadening top is special because it has a partial rise. New research shows that a partial rise correctly predicts a downward breakout 67% of the time in a bull market. To spot a partial rise, look for the pattern to become established, meaning that price should touch each trendline at least twice. Then look for price to rise from the bottom trendline but not come close to or touch the top trendline. A downward breakout usually follows when price returns to the lower trendline. ...Continued in the March issue of Technical Analysis of STOCKS & COMMODITIES
Excerpted from an article originally published in the March 2005 issue of Technical Analysis of STOCKS & COMMODITIES magazine. All rights reserved. © Copyright 2005, Technical Analysis, Inc.
Return to March 2005 Contents