In my February 2005 column, I hinted about coming up with a new trading system. That was because the number of trades I was making per month had dwindled to one or two - if I was lucky. So I decided to spend some time observing the market to identify any changes in market behavior and integrate them into my system in the hopes that it would generate more trades.
As it turns out, I am still observing the market, so I will not be walking you through a trade this month. Instead, I will show you how breakouts above moving averages can be used to your advantage.
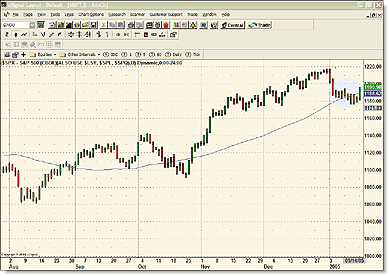
Let's take a look at the daily chart of the Standard & Poor's 500 in Figure 1. You can see that ever since January 5, 2005, the S&P 500 had been hovering slightly above its 50-day moving average. But would the S&P 500 stay above the moving average or drift below it?

FIGURE 1: DAILY CHART OF THE S&P 500
It wasn't until January 11 that there were signs of a breakdown. During the course of the trading day, the S&P 500 did move below the 50-day moving average, and even closed just below it. But it was still too close for comfort, and there was no telling whether the index would stay above or below this moving average.
The next trading day - January 12 - the S&P 500 did drop below its 50-day moving average - quite significantly, I would add. However, the S&P showed an upward bias during the day. It closed above the moving average, but again, not by much. The S&P was still being pesky.
The next day, there was a drastic move that showed a downward bias. It didn't happen until the end of the trading day. In the last hour of trading, the S&P 500 took a nosedive and closed well below the moving average, which, interestingly, acted as a resistance level.
That the S&P 500 stayed below the moving average on the following trading day (January 14) was not a surprise, although the close was near the high of the day. I still wasn't convinced that it would continue lower, and the trading day after that (January 17), the upward bias followed through. On January 18, the S&P 500 broke above its 50-day moving average at around 1190.
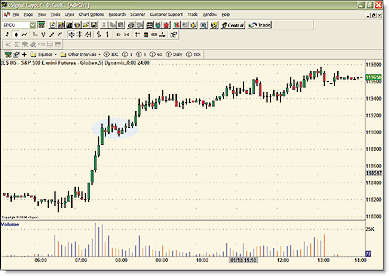
Ideally, this would have been a great place to enter a long position on the emini contracts. If you look at the five-minute chart of the emini in Figure 2, you'll note that there was a slight pullback to that 1190 level at around 8:05 am, after which prices continued to move up slowly. Had I entered a long position at that level, I could very easily have made my two-point objective. In fact, I would probably have made four points, since there wasn't much volatility in price movement and I wouldn't have been stopped out of my position.

FIGURE 2: FIVE-MINUTE CHART OF THE EMINI
Perhaps, as far as my trading system is concerned, there isn't too much that needs changing. I still use the 50-day moving average as a trend direction indicator. For those of you who have been keeping up with my columns, you'll know that when the S&P 500 is above its 50-day moving average, I only enter long positions. When it's below the moving average, I only enter short positions.
Maybe it's the wait until the 11:00 am PT surge in trading that needs to be changed. I have noticed that, more often than not, there is a surge in trading volume in the last half hour of trading. This is nothing new, but unfortunately, that's when I have my lunch.
Perhaps all that needs changing is my lunchtime.
-Jayanthi Gopalakrishnan, Editor
Originally published in the March 2005 issue of Technical Analysis of STOCKS & COMMODITIES magazine. All rights reserved. © Copyright 2005, Technical Analysis, Inc.
Return to March 2005 Contents