A Classic Application For Modern Markets
Darvas-Style Trading
by Daryl Guppy
The markets have changed since the 1960s, with the weekly trading volumes of those days often exceeded by a single day of trading now. With that in mind, can classic techniques such as Darvas-style trading still work?
WHY DARVAS?
Darvas trading defines an uptrend by constructing a series of imaginary boxes based on a price chart. Each box contains a set of price moves. Each new box sits on top of the previous box like a set of rising stairs. When price moves above the upper edge of the box, it means the continuation of a trend is confirmed. The trend ends when prices close below the bottom of the current box. These upper and lower limits create a Darvas box and define the acceptable bullish and bearish range of prices.
For several years, this approach was tested in current markets with real trades and modifications consistent with the logic of the Darvas method, but taking into account changes in volatility that characterize modern markets. These included applications to breakout trading using a different set of initiating triggers while applying the basic method.
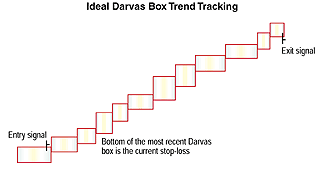
The Darvas trading technique provides a useful way to manage longer-term trending positions. It is designed as a method of capturing the strength of the trend. The buy signals are generated on new bullish strength, managed by using the six-day volatility range to set a stop-loss. The limits of this strength and weakness set the perimeters of the Darvas box (D_Box). The bottom of the box is used as a stop-loss point. Ideally, the box construction moves steadily upward with the trend, with a trailing stop-loss lagging just behind current price action (Figure 1).

FIGURE 1: IDEAL DARVAS BOX TREND TRACKING. In an ideal scenario, the construction of the boxes moves steadily upward with the trend. The bottom of the most recent Darvas box serves as the stop-loss level.
...Continued in the May issue of Technical Analysis of STOCKS & COMMODITIES
Excerpted from an article originally published in the May 2005 issue of Technical Analysis of STOCKS & COMMODITIES magazine. All rights reserved. © Copyright 2005, Technical Analysis, Inc.
Return to May 2005 Contents