Identify And Trade Formations
Detecting Breakouts From Flags & Pennants
by Markos Katsanos
Here's a system to identify and trade flag and pennant formations.
In my previous article, I wrote about the measuring implications, duration, and identifying characteristics of flags and their variations, and promised to present a system to identify and trade these short-term and highly profitable formations. I constructed a viable system by distilling the most useful statistics together with technical observations of 100 flag and pennant samples. I optimized the test parameters in further out-of-sample testing of a list of 250 stocks.
In this article, I have presented the formula and methods used in this system, along with the test results on four stocks. I found the most profitable test returned an adequate 187% profit being only 8% of the time in the market, versus a tragic 91% loss for the buy and hold investor.
A frequent trader, however, will need to wait for the next entry signal, since the system test produced only one trade per year on average. Nevertheless, this need not be a major disadvantage, as a daily scan of a large database of stocks is bound to produce a few trades. I ran a MetaStock exploration on a database of 1,250 stocks and produced 13 hits. Results were highly profitable, producing an annualized 735% profit.
TEST DESIGN
The formula language of off-the-shelf technical analysis programs like MetaStock might be easy to use for the usual tasks but presents major limitations in recognizing patterns or formations. On the other hand, a lower-level programming language can be more effective but will require extensive and tedious programming.
Nevertheless, I did my best to design a system that identified an adequate number of flags and pennants, using only the formulas available in MetaStock (see sidebar 1, "MetaStock code: system test, flags & pennants"). I did so with only nine lines of code, as opposed to more than a hundred that would have been required had I used a lower-level programming language instead. I do not claim, however, that the system can identify all possible flag patterns that could be detected visually or otherwise.
I used mainly the zigzag and linear regression slope function to identify the patterns. The zigzag function identified the flagpole top, and the linear regression slope ensured that a steep and quick move was followed by a sideways or slightly down flag formation. The following test conditions were used to identify the pattern.

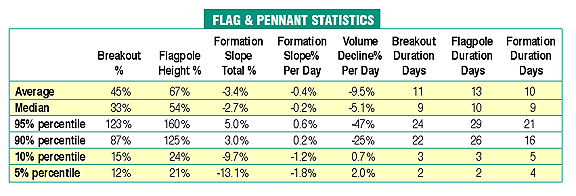
Figure 1: Statistics for bullish-only formations. The percent breakout is measured from the point at which the upper trendline is broken in an uptrend. The duration is in trading days and does not include weekends and holidays. The formation characteristics are divided by percentiles according to values below which certain percentages of cases fall. So for example, the 5% percentile of the formation duration is four days, which means that 5% of the formations will last for four days or less.
...Continued in the May issue of Technical Analysis of
STOCKS & COMMODITIES
Excerpted from an article originally published in the May 2005 issue of Technical Analysis of STOCKS & COMMODITIES magazine. All rights reserved. © Copyright 2005, Technical Analysis, Inc.
Return to May 2005 Contents