Fanlines And Fibonacci
Retracement Analysis Beyond The Horizontal
by Cornelius Luca
If you are a currency trader, then you need to know your trends. Here's how you can monitor the health of a trend in the currency markets.
Currencies may be one of the best-trending financial instruments, so monitoring the health of the trend is an extremely important responsibility for those who trade currencies. While at times you will enjoy surging trends, such as the downtrend experienced by the dollar/Norwegian krone in the last quarter of 2004 (Figure 1), this is the exception to the rule.
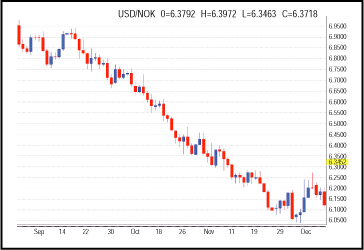
FIGURE 1: CLASSIC DOWNTREND. A dollar/Norwegian krone downtrend is formed during the last quarter of 2004.
Trending currencies will typically be subject to several pullbacks or retracements due to short-term countermoves, profit-taking before and after the release of significant economic indicators, and bargain-hunting. When it comes to analyzing retracements, traders generally use Fibonacci levels. And yet, this statement is only partly accurate; the levels are only ratios, and there's more to it than applying the standard group of three horizontal lines at 38.2%, 50%, and 61.8%. (In fact, 50% is not even a Fibonacci retracement level but it's bundled in, due to its high technical significance.)
In addition to these three ubiquitous horizontal lines, there are two other ways to apply the Fibonacci ratios for retracement analysis: fanlines and arcs. This article will focus on fanlines and will also compare them to the standard Fibonacci horizontal lines.
FIBONACCI'S BACKGROUND
The Fibonacci ratios are named after the 13th-century Italian mathematician
Leonardo of Pisa, better known by his nickname, Fibonacci (an abbreviation
of filius Bonacci; filius is Latin for "son of"). Little
is known of him except for his famously having introduced Hindu-Arabic
numerals to western Europe in his work titled Liber Abacci ("Book
of Calculations"), and the number sequence that is named after him.
As many of you may remember from your studies, Fibonacci, through the process of solving a mathematical riddle, discovered a unique sequence of ascending numbers in which every new term consists of the sum between the previous number and itself, starting with zero. The beginning of the series is as follows:
0, 1, 1, 2, 3, 5, 8, 13, 21, 34, 55, 89, 144, 233, 377, 610, 987, 1597,
2584, 4181...
...Continued in the June issue of Technical Analysis of STOCKS & COMMODITIES
Excerpted from an article originally published in the June 2005 issue of Technical Analysis of STOCKS & COMMODITIES magazine. All rights reserved. © Copyright 2005, Technical Analysis, Inc.
Return to June 2005 Contents