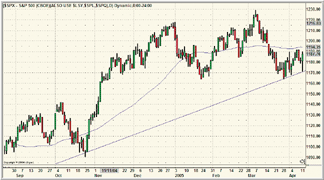
The Standard & Poor's 500 index has not really been doing much of late to get excited about. If you look at the daily chart of the index in Figure 1, you will see that it has been bouncing around between its upward sloping trendline (support) and its 50-day moving average (resistance). It has tested that support level three times, but I am waiting for it to break out above that resistance level before even thinking of going long.

FIGURE 1: THE STATE OF THE MARKETS. To get an idea of how the broader markets are performing, I prefer to look at the S&P 500 with the 50-day moving average overlaid. With the S&P 500 being below this moving average, I would consider it unwise to open any long positions.
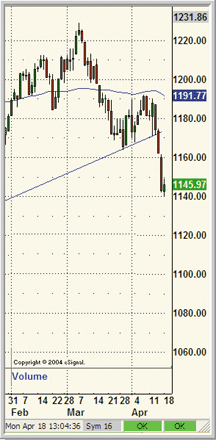
Or perhaps the index will break below the trendline that has been acting as a support level. And as it turned out, a few days later, it was the latter scenario that traders were confronted with, which actually surprised me (Figure 2). I was under the impression that with oil prices coming down slightly, the equity markets would become more bullish. In fact, I was looking for crude oil prices to hit at least $52 a barrel before equity markets turned up. But it seems that the drop in oil prices didn't have a positive effect after all.

FIGURE 2: EVERY DAY, A NEW STORY UNFOLDS. As it turned out, the S&P 500 fell below its 50-day moving average, which reversed investor sentiment.
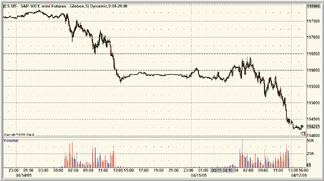
When all is said and done, I suppose the one positive sign of this action was that I knew it was time to short the emini contract. At least I no longer have to stare at the markets waiting for something to happen. S&P 500 levels fell below their 50-day moving average, and that means only open short positions. As you can see from the intraday charts of April 14 and 15 in Figure 3, there were several shorting opportunities throughout the day, with the sharpest selloff being most prominent toward the close of both trading days. There were fundamental factors such as disappointing earnings numbers from Ibm that had an effect on the behavior of the market. Needless to say, I didn't make any trades on those days.

FIGURE 3: INTRADAY CHARTS SHOWING THE SHARP SELLOFF. You can see from the charts that when there is a selloff, everybody runs with the pack. You wouldn't want to get left behind.
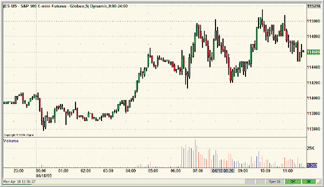
I thought I'd give it a try on the next trading day, which was Monday, April 18 (Figure 4). It was clear that there would not be a reversal, so I opened a short trade at 1148 and covered it at 1145 for a three-point profit. I could have probably made a lot more had I taken advantage of the selloff in the previous two days, but for some reason I wasn't able to concentrate on the markets so I thought it best to stay away from making any trades.

FIGURE 4: AND NOW FOR A TRADE. Perhaps not the best in terms of what opportunities are available, but a good trade nonetheless.
There may be more days where shorting opportunities will abound. Looking at the daily chart of the S&P 500, the next obvious support level seems to be at the 1090 to 1100 level. In October 2004, there was some congregation of price bars at this level. I also considered a head & shoulders top formation in the S&P 500, which could possibly bring prices down to as low as 1100 to 1110 level, which coincides with the level I mentioned earlier. So, this means that essentially it could be a long ride down. Then again, each day is a new story.
--Jayanthi Gopalakrishnan, Editor
Originally published in the June 2005 issue of Technical Analysis of STOCKS & COMMODITIES magazine. All rights reserved. © Copyright 2005, Technical Analysis, Inc.
Return to June 2005 Contents