Reversing Trendlines To Predict Price Action
Look Back Before You Leap
by Richard Bergner
Look to the past to predict the future: It's a new way to predict commodity price action as you study a chart.
How can you find good trading opportunities? Imagine, if you will, all the ways you've read or heard about how to do so. But if you're aware of those opportunities, you can be sure that others are as well, thus lessening your chances of profiting from them. If you want a different way to identify good trading opportunities, why not examine a market's behavior in reverse? That's right -- look to the past to mark trends that have a good chance of materializing, as you step toward the future.
REVERSE TRENDLINES
One method I like uses reverse trendlines to home in on potential trading zones. But what are reverse trendlines? Everyone knows that by simply extending trendlines from the past, you can estimate the future and be better prepared to trade. But instead of using normal trendlines that connect support points in an ascending move and supply points during a descent, reverse trendlines are drawn along the highs when prices are rising and drawn along the lows when prices are falling. These lines represent momentum, which is reflected by the points of contention where supply and demand come together, and where either supply or demand overcomes the other, thus turning prices in the opposite direction.
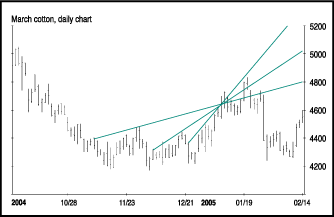
When surveying a chart, I like to look at those reverse lines whose trajectories tend to meet at one specific point (Figure 1). This means I would use a line from a previous series of upward moves whose angle of ascent would be less than that of the next reverse line, which I identify as I shift to the right on the chart.

FIGURE 1: A BOTTOMING PHASE. By drawing reverse trendlines on this March cotton chart, you can see that a bottom has been reached.
That next identified line would most likely be an upward sloping line off of two successive highs occurring during the corrective phase of the most recent uptrend. One example would be a line drawn on the B wave of an ABC correction. Furthermore, during a bottoming phase, the minor corrective rallies identify reverse trendlines (up) with each successive rally occurring at a lower level along the way. The further you move down and to the right of the chart, the more likely it is you should look for reverse lines with steeper angles of ascent so that the two, three, or more lines will all converge at one point. If you place this point of convergence to the right of the current action on the chart, you can visualize this as a new target for a rally.
...Continued in the July issue of Technical Analysis of STOCKS & COMMODITIES
Excerpted from an article originally published in the July 2005 issue of Technical Analysis of STOCKS & COMMODITIES magazine. All rights reserved. © Copyright 2005, Technical Analysis, Inc.
Return to July 2005 Contents