Select, Recognize, And Create With Statistics
Targeting Your Pattern
by Massimiliano Scorpio
Previously, my articles were focused on finding your favorite configurations using EasyLanguage (EL). I started using a very simple methodology (the reversal pattern) and then continued observing the relationship between the open and the close, respective to the previous bar (hot zones).
In this article I use a more sophisticated approach to show a “complete” way to select, recognize, and come up with statistics on specific two-bar patterns. You will see how every bar, on any time frame, can be “scanned” using the EL code and provide some useful information to make your decisions more objective. The basic code is completely disclosed, so you have the flexibility to personalize and implement it, especially with regard to the statistical inputs.
CODE SETUP
In my quest to easily understand market behavior, I found that I needed an extremely objective approach to make sure that everyone could come up with the same conclusions I did.

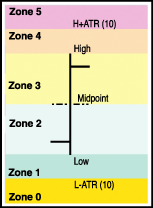
FIGURE 1: THE HOT ZONES. Here you see a single price bar divided into five zones.
Starting from the same point that I did in the hot zones article, I created a specific algorithm (see msPattPos Function in the sidebar) to compare each of the single elements of a market bar (open/high/low/close) with the previous bar range and place it in a well-defined zone. Each zone has a numerical reference, so the algorithm will return a sort of “four-number code” to pinpoint that specific pattern. In Figure 1, the single bar is divided into zones (from zero to 5). Here is the description of each zone:
• If the single component of a bar (open/high/low/close) is positioned below the previous low, at a distance greater than a 10-bar average true range (ATR), then a value of zero is assigned.This way, if you are, for example, talking about the 3535 configuration, it will not generate any ambiguities. You will know that it refers to a mega upbar that opens just a little below its previous high, and closes well above the 10-bar ATR.• If the single component of a bar (open/high/low/close) is positioned below the previous low, at a distance less than (or equal to) a 10-bar ATR, then a value of 1 is assigned.
• If the single component of a bar (open/high/low/close) is positioned above or at the previous low but below the line calculated as the average between previous high and previous low (midpoint), then a value of 2 is assigned.
• If the single component of a bar (open/high/low/close) is positioned above or at the average between previous high and previous low (midpoint) but below the previous high, then a value of 3 is assigned.
• If the single component of a bar (open/high/low/close) is positioned above or at the previous high, at a distance lesser than a 10-bar ATR, then a value of 4 is assigned.
• If the single component of a bar (open/high/low/close) is positioned above the previous high, at a distance greater (or equal) than a 10-bar ATR, then a value of 5 is assigned.
This is the first EasyLanguage function I'll use as the basis for the
final code.
...Continued in the July issue of Technical Analysis of STOCKS & COMMODITIES
Excerpted from an article originally published in the July 2005 issue of Technical Analysis of STOCKS & COMMODITIES magazine. All rights reserved. © Copyright 2005, Technical Analysis, Inc.
Return to July 2005 Contents