Emerging Patterns Of Profitability
Rising And Falling Overnight Sessions
by Anthony Trongone, Ph.D.
Don't overlook how the performance of an individual stock affects the direction of an index-tracking stock or commodity. Here's an example using the NASDAQ 100.
If history is any guide, knowing how and when individual companies perform within an index-tracking stock or commodity will help you identify profitable trading opportunities. Keeping track of the results could allow you to see a positive impact on your returns as the trading day comes to a close.
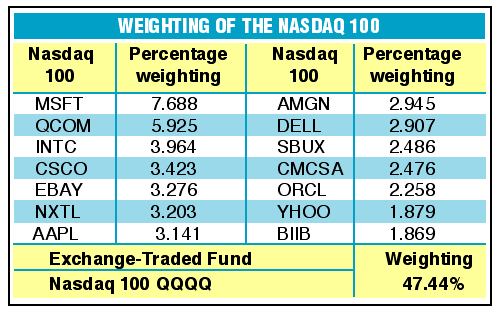
To find out how this works, I focused on the 14 companies with the highest market capitalization in the NASDAQ 100 covering 770 trading days from January 2, 2002, to January 21, 2005. These companies (Figure 1) represent a cumulative weighting of 47.44% of the overall index. This extensive analysis will provide you with reliable trading strategies as well as the knowledge necessary to give you a statistical advantage when taking a position at either the open or close.
The astute trader observes the effect of a difference in the rising or falling overnight trading session. Consider, for instance, what the cumulative results are when taking a long position at the start of the regular session after it experiences a rising or falling overnight session. After rising in the overnight session, there was a loss of -$190.74, but the company came away with $302.84 worth of earnings in the regular trading session.
Since 11 stocks as well as the index-tracking stock were unable to produce similar performance results within each trading session (that is, stocks with a pattern of success overnight were unprofitable in the day session, but stocks with a pattern of failure in the overnight session are profitable during the day), several reliable trading strategies are possible. You can easily profit from these opportunities by simply trading one stock against another, one stock against an index-tracking stock or commodity, or by simply trading the index-tracking stock or the futures contract.

FIGURE 1: WEIGHTING OF THE NASDAQ 100. The largest 14 stocks contribute a weighting of 47.44%.
Excerpted from an article originally published in the July 2005 issue of Technical Analysis of STOCKS & COMMODITIES magazine. All rights reserved. © Copyright 2005, Technical Analysis, Inc.
Return to July 2005 Contents