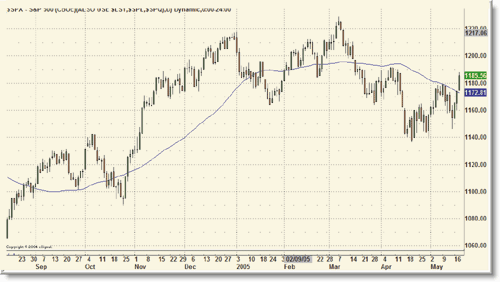
It doesn't hurt to remember that the simplest of indicators can provide a great deal of information. I'm looking at the daily chart of the Standard & Poor's 500 index when I say this because I can't think of a better example of the behavior of the 50-day simple moving average (SMA). Note from the chart in Figure 1 how it acts as a resistance level. The average is sloping down, and on May 9, 2005 and the following day, prices hit that level and moved down. I have actually used this indicator for my long-term investments. When the value of the S&P 500 fell below the 50-day SMA, I moved all my long-term investments into stable value funds. Although my returns weren't stellar, at least I can boast by saying that they didn't lose any money.

FIGURE 1: THE 50-DAY SIMPLE MOVING AVERAGE. This moving average has acted as a good threshold for identifying support and resistance levels.
May 18, 2005, saw a turn of events. The S&P 500 moved up above its 50-day simple moving average quite significantly. It also broke out from the downward sloping trendline that extended down from the high reached on March 7, 2005. Considering that two resistance levels were exceeded, does it mean that a reversal is about to commence?

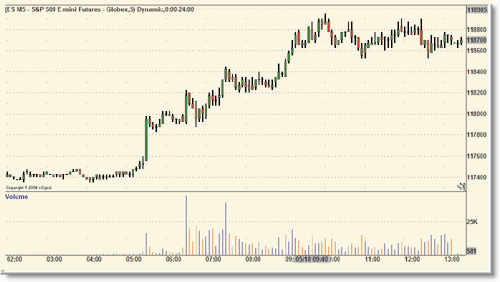
FIGURE 2: FIVE-MINUTE INTRADAY CHART OF THE JUNE EMINIS. A slow gradual rise in prices makes it difficult to identify entry and exit points.
The five-minute chart in Figure 2 of the June 2005 emini contract shows how the day panned out. There was a spike in price before the market opened. There was another spike after the market opened, but apart from these, there weren't really many high-momentum scenarios to capitalize on. Prices just moved up slowly, ending the day at a level close to the high. But you could have purchased contracts at the open and held on to them till the close. The chance of being stopped out of your trade would have been very slim, unless your stops were really tight.
Suppose you still had an open position at the end of the trading day. You have to decide when to exit your position, and to do that, it's best to take a good look at the daily chart of the S&P 500. The first factor you should take note of is that your decision will rest on how prices react to the 50-day SMA. If the trend does indeed continue to move up, then the SMA would act as a strong support level. If that were the case, where would the next resistance level be? From Figure 1, I noticed that the next possible resistance level lies somewhere between 1192 and 1197. The value of a mini contract is not too far away from that level. It's just a matter of time before we see how the market behaves when it hits that area.
--Jayanthi Gopalakrishnan, Editor
Originally published in the July 2005 issue of Technical Analysis of STOCKS & COMMODITIES magazine. All rights reserved. © Copyright 2005, Technical Analysis, Inc.
Return to July 2005 Contents