CHARTING THE MARKET
PIERCING PATTERNS
Writing about dual candle lines in his book Beyond Candlesticks, Steve
Nison recalls a particularly vivid (and metaphoric) description of a "piercing
pattern" in Japanese candlestick analysis:
... [T]he last of the bulls that were backed into a corner and came
out fighting in a heroic fight. Kamikaze fights are always frightening,
so the bears seeing this take to the sidelines for the moment. In this
quiet period, the bulls may get reinforcements, or after all the selling
that has occurred, the supply road for the bears may be already broken.
Great action. But something in this eludes me when I think about piercing patterns. In looking at what happens in a piercing pattern, what I see is almost wholly a reaction to overreaching. I don't see a "quiet period," in which reinforcements gather like the colonists crossing the Delaware River on the night before Christmas to surprise the British troops during the American Revolution. No, piercing patterns remind me more of World War II's Battle of Stalingrad.
Why so? Not just because Stalingrad-like the piercing pattern-marked a major reversal, but also because the Battle of Stalingrad was the effort of one army to completely finish off the other. And in its zeal to demolish the defending army of the Soviet Union, the advancing army of Nazi Germany stretched its supply lines, taking territory that it could not hold. When the reversal came, the rout was severe enough to turn the tide against the aggressors, establishing a new trend in that theater of the conflict.
An effective piercing pattern is no less dramatic to the dedicated candlestick trader-and can bring about consequences no less crushing to the advancing bears. Part of what can be so notable about a piercing pattern reversal is that, on the day of the piercing pattern, the market still seems to be moving in the direction of the bears, opening below the previous session's close and suggesting to all observers that the declines of the recent past have continued into yet another session.
Then, suddenly, the bears' advance stalls, stops, and begins to reverse. This action alone clearly suggests that bulls have arrived-and in greater numbers than had been the case for several sessions. The bears, which previously had found the battle to be an easy downhill march, are surprised to find themselves in a real fight. And by this time, bulls tend to have support at their back, while bears have long since stopped relying on resistance to help press their case and have been carrying the fight to the bulls on their own merits-merits that are increasingly thinning out.
As Nison observes in his first book on candlesticks, Japanese Candlestick Charting Techniques:
The bears are watching the market with contentment. Then the market surges toward the close, managing not only to close unchanged from the prior (session's) close, but sharply above that level. The bears will be second-guessing their position. Those who are looking to buy would say new lows could not hold and perhaps it is time to step in from the long side.
If anything, Nison's account of the psychology of piercing patterns here underplays both the panic of the bears and the almost-foolhardly courage of bulls looking to buy at the lows. This is particularly so if the bulls are able to close the piercing pattern day deep within the trading of the previous selling day. In such a scenario, the bears can find little comfort from the previous day's down close. The higher closing high has been made, and any bull with the nerve to do so now has a support point or pivot point from which to begin buying.
Nison goes on to suggest that the more the piercing pattern session penetrates into the previous bearish session, the more likely the piercing pattern will result in a reversal. This seems commonsensical-though Nison seems to emphasize the point mostly to distinguish between a variety of patterns (that is, "on-neck," "in-neck," and "thrusting" patterns) that resemble piercing patterns but do not ensure reversals. In fact, these formations are regarded as outright bearish by strict Japanese candlestick analysts because of the inability of the bullish session to move deeply (at least halfway) into the body of the previous bearish session.
Let's take a look at some piercing patterns in action to see how powerfully markets can respond to them.
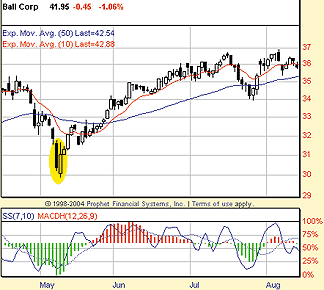
In Figure 1, the piercing pattern develops shortly after the 10-day exponential moving average (EMA) (red) slipped below the 50-day EMA (blue) in May 2004. The market for Ball Corp. stock (Bll) had gapped down twice in recent days, and the big down day that followed would have been enough to draw the attention of most bears looking to short the stock. However, the fact that the market opened down the following day, yet rallied throughout to close well within the range of that previous down session, would have been enough to encourage most bears to-at a minimum-get flat until more follow-through appeared to the downside. Every session that saw Bll make a higher low was a new reason for bears to consider staying out of the way-if not jumping ship altogether to join the bulls.

FIGURE 1: PIERCING PATTERN. A piercing pattern in early May set up a major reversal in shares of Ball Corp. Note also the positive stochastic divergence that underscores the likelihood of a bullish reversal.
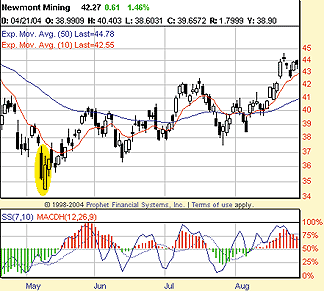
Although not quite as dramatic as the reversal in Ball Corp., the piercing pattern in Newmont Mining (NEM) similarly provided a strong signal that prices were likely to reverse and head higher (Figure 2). Here, the bear market was relatively more pronounced, with the 10-day EMA diverging widely from the 50-day EMA. It was this overextended spread that contributed to the wildly oversold condition in shares of NEM-an oversold condition that was resolved not just in the piercing pattern, but also in a positive stochastic divergence.

FIGURE 2: LONG TOP SHADOW. The long top shadow on this piercing pattern doesn't negate the strength of the reversal it portends. Again, a positive stochastic divergence helps build the argument for reversal.
This combination of technical factors-the oversold condition, the positive stochastic divergence, and the piercing pattern-would have provided aggressive bulls and cautious bears all the evidence they would have needed to begin preparations for a reversal in Newmont Mining.
David Penn is Technical Writer for Stocks & Commodities.
Suggested reading
Nison, Steve [1991]. Japanese Candlestick Charting Techniques, New
York Institute of Finance.
_____ [1994]. Beyond Candlesticks, John Wiley & Sons.
Learn more about Japanese candlestick patterns!
Austin, Margaret [2004]. "Candlesticks 101: Doji," Working Money:
June 3.
Bigalow, Stephen [2004]. "Market Timing With Candlesticks," Working
Money: February 25.
Gujral, Ashwani [2004]. "Combining Candlesticks And Trendlines,"
Working Money: May 27.
Maiani, Giovanni [2002]. "How Reliable Are Candlesticks?" Working
Money: August 27.
Manuell, Chris [2004]. "On Oil: Reversals, Candlesticks, And Gaps,"
Working Money: December 15.
Morris, Greg [1991]. "Candlesticks And Stochastics," Technical Analysis
of Stocks & Commodities, Volume 9: August.
Penn, David [2004]. "Crosses, Candlesticks, And Q-Stick," Working
Money: November 19."
_____ [2002]. "Connors' Undeniables And Candlestick Clarity," Working
Money: August 20.
Peterson, Dennis [2003]. "Trading Candlestick Patterns," Working
Money: April 1.
Wagner, Gary S., and Matheny, Bradley L. [1991]. "Pattern Recognition
And Candlesticks," Technical Analysis of Stocks & Commodities, Volume
9: September.
_____ [1993]. "Candlesticks And Intraday Market Analysis," Technical
Analysis of Stocks & Commodities, Volume 11: April.
Yamanaka, Sharon [2002]. "When Candlesticks Cast Long Shadows,"
Working Money: March 12.
?Prophet Finance
Excerpted from an article originally published in the August 2005 issue of Technical Analysis of STOCKS & COMMODITIES magazine. All rights reserved. © Copyright 2005, Technical Analysis, Inc.
Return to August 2005 Contents