The Hunt For Superior Signals
Two Moving Function Hybrids
by William Rafter
Find out how to use these smooth and timely indicators.
THE RATE OF CHANGE
Two of the common momentum indicators used by traders are the change and rate of change (commonly referred to as ROC). The latter is really only the former divided by price, but it has the advantage of being price-independent — that is, by comparing the 25-day changes of two datasets, you must be mindful that the datasets may be priced differently. By taking their rates of change, you eliminate the price bias.
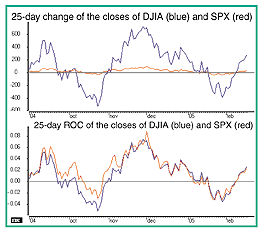
For example, compare the two panes of Figure 1. The top pane illustrates the 25-day change of the closes of the Dow Jones Industrial Average (DJIA) and the Standard & Poor's 500 (S&P). The price differences of the respective indexes make comparison almost impossible. The lower pane shows the indexes compared on the basis of their 25-day ROCs, which is considerably more useful than the top pane.

Figure 1: CHANGE VS. RATE OF CHANGE. The top pane shows the 25-day change of the closes of DJIA (blue) and SPX (red). The bottom pane shows the 25-day ROC of the two indexes. Note that the comparison of the two indexes based on ROC is more useful than just basing it on the change in price.
Instead of taking the change between the price (say, 25 days ago and today), take the regression line (also referred to as the least-squares fit) of those 25 days and calculate the slope of that line. The slope is merely the vertical change in that line from the first day to the last, divided by the horizontal change. Do this on a moving basis and you have the moving slope. The calculations are not difficult, as most standalone market software products have the capability to do least-squares fits. (Note that a two-period moving slope is identical to a one-period change. That equality, however, will rarely exist beyond that first day.) Figure 2 illustrates the S&P 500 with the 25-day moving slope and both the 25-day ROC and 25-day relative strength index (RSI) shown for comparison.
...Continued in the September issue of Technical Analysis of STOCKS & COMMODITIES
Excerpted from an article originally published in the September 2005 issue of Technical Analysis of STOCKS & COMMODITIES magazine. All rights reserved. © Copyright 2005, Technical Analysis, Inc.
Return to September 2005 Contents