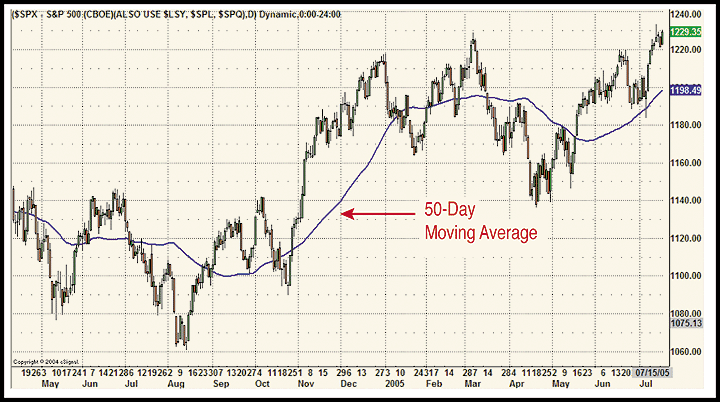
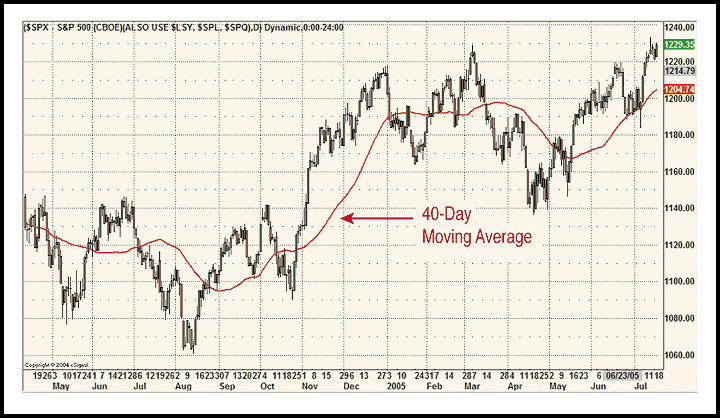
The S&P 500 has done a good job staying above its 50-day moving average since May 18, 2005 (Figure 1). There was only one day (7/07/05) when it hit a point below the MA, but that drop proved insignificant at the end of the day—the closing value was once again well above the MA. For the moment, things are looking good for S&P traders. In light of this scenario, I applied the tighter, 40-day moving average on the daily chart. As you can see in Figure 2, I found it to act as a more accurate support level from 6/24/05 to 7/8/05. With that in mind, the chart shows the S&P 500 as healthy, with possibilities of holding onto positions for a little longer than one day.

Figure 1: A HEALTHY UPTREND. The S&P 500 has been displaying a positive trend since mid-May.

Figure 2: A TIGHTER MOVING AVERAGE. The 40-day moving average acted as a better support level from 6/24/05 to 7/8/05.
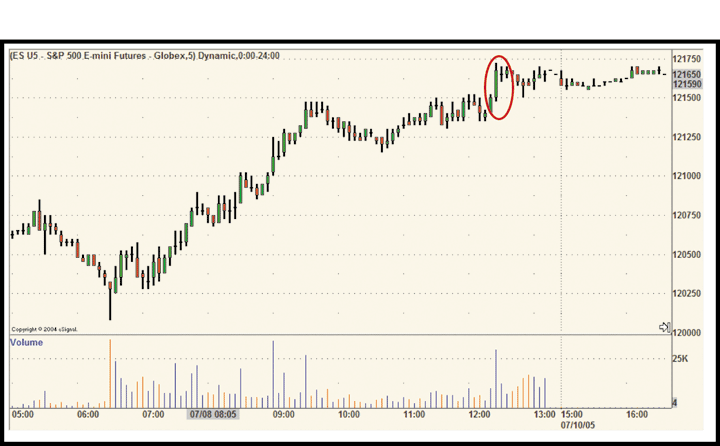
Take July 8, 2005 for example. On the 5-minute chart of the S&P 500 emini contract in Figure 3, you can see there was a surge in volume at 12:25pm. If you had opened a position at say, 1215.50, when a new high for the day was made, and if you had held that position until the next trading day, you would have gained a hefty return. Of course, this is easy to say in hindsight. If you are accustomed to exiting your positions before the close, it's very difficult to hold onto a position overnight, or in this case, through the weekend.

FIGURE 3: TRADING THE E-MINI. On July 8, 2005, there was a surge in volume towards the close of the day.

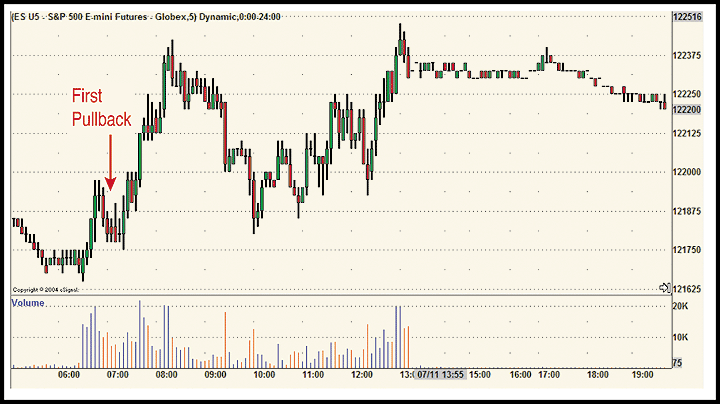
FIGURE 4: WHERE DO YOU EXIT? If you had held the position till the following trading day you could have made a tidy profit even by exiting at the first pullback.
What might have prompted you to hold the position instead of exiting before the close? Given that it was a Friday and the market would be closing in 35 minutes, a sell-off would be expected. In this case, however, we didn't really see a sharp sell-off. Instead, what we saw was a slight pullback, with the markets continuing up... and they continued doing so for a few more days. I would have probably exited my position during the first pullback in the first half hour of trading on Monday, merely because I tend to be a conservative trader (Figure 4). I might have reentered a position later in the trading day, because there was a clear build-up of momentum, which would have created profitable long entries.
The S&P 500 is still in a healthy uptrend with respect to its 40- and 50-day moving averages. How long this will continue remains to be seen—but you know what to do if it drifts below the moving average.
—Jayanthi Gopalakrishnan, Editor
Originally published in the September 2005 issue of Technical Analysis of STOCKS & COMMODITIES magazine. All rights reserved. © Copyright 2005, Technical Analysis, Inc.
Return to September 2005 Contents