Access to foreign exchange trading has opened up exciting trading options for the retail trader. You can now trade alongside corporations and institutions in a highly liquid market that is global, traded around the clock, and highly leveraged. Before jumping into this market, however, we must understand the factors that affect the forex market. With that in mind, Stocks & Commodities is introducing Forex Focus to better prepare the retail trader to participate in the currency market.
Here are some strong, classical technical signals favoring a euro/dollar trend reversal.
Date: 5/23/05
Closing price of Eur/usd: 1.2595
At the beginning of January 2005, I studied the relationship between the euro and the US dollar and the 10-year Bund-Treasury bond differential and analyzed how it tied in with the technical picture of the euro/US dollar. Given the Elliot wave counts and the yield differentials moving in favor of the US dollar, the indications were that the euro would fall. This is a follow-up article, aimed at finding out whether there are any further technical analysis points to be noted, and what the future might hold.
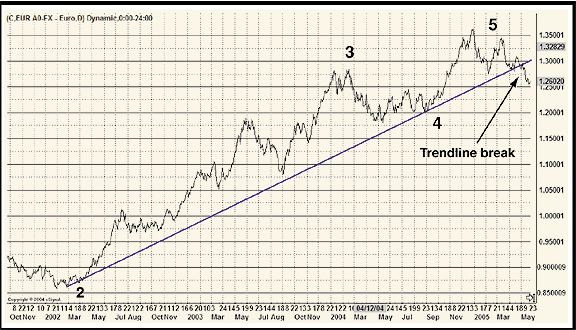
If you look at Figure 1, this is perhaps one of the most classic technical bear turnaround setups in the currency markets in a long time. First note the Elliot waves count on the euro uptrend that started in late 2000. Wave 5 was completed toward the end of December 2004, as marked in the chart, and the euro started falling thereafter.

Figure 1: Trend reversal? Note the break in the upward sloping trendline that connects waves 2 and 4.
The price level has now broken the trendline connecting the wave 2 and wave 4 lows. As the chart suggests, the previous uptrend is now in question. Could this be a trend reversal?
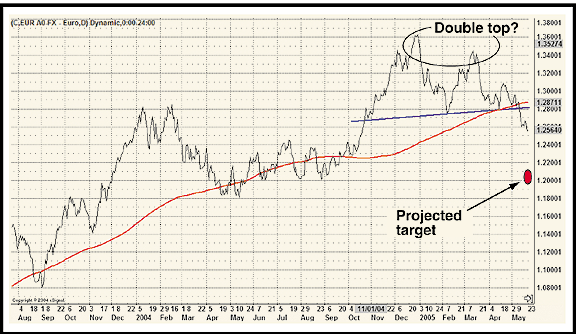
If you zoom into a shorter period (see Figure 2) in the adjoining chart, you can see some clear possibilities of a classic double top, with a neckline near 1.2750. The classic technical target for this double top would be near 1.20. In addition, the euro/dollar is now trading below its 200-day moving average. Thus, what you are seeing are several strong, classic technical signals favoring a euro/dollar trend reversal. Specifically, these signals are:
- Completion of a five-wave uptrend from October 2000
- Break of trend support coming up from April 2002
- Double top created since November 2004, with tops registered in December 2004 and March 2005
- A negative crossover on the 200-day moving average.

Figure 2: formation of a double top. This double top formation shows that prices could fall to 1.20.
NOT ALL AT ONCE
As Albert Einstein said of time, "The only reason for time (to exist) is so that everything doesn't happen at once." One of the most intriguing facets of the market (as of life) is that even when technical targets are clearly known and set, they do not materialize immediately.
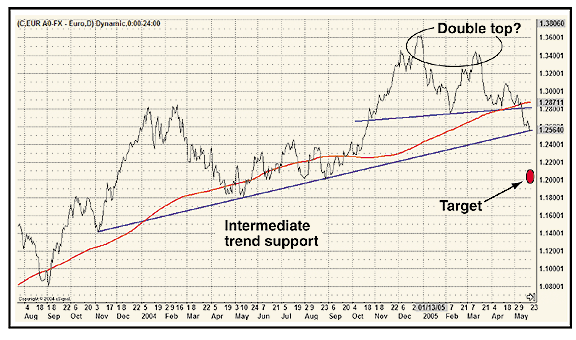
It takes time for the market to reach where it has to because it needs to overcome obstacles on the way. One such obstacle is shown in Figure 3. We've seen that the uptrend since 2002 has been broken (Figure 1) and there is a clear double top (Figure 2).

Figure 3: Intermediate Support. At this point, it is difficult to say whether there'll be a bounce to 1.27 before a trendline break.
But there is an intermediate trend support coming up from November 2003, which provides support to the euro just above 1.2500. This has to break for the target of 1.20 to be achieved. The big question is, "Will there be a small bounce to 1.27 before the trendline break, or will there be a clean break?" If euro bears (who might have sold near 1.35) book profits, a bounce may happen. If they do not and add to positions instead, a clean break might happen.
FROM TECHNICAL ANALYSIS TO TRADING
While technical analysis enables you to project chart targets with reasonable accuracy, it is not always easy to know the path the market will take and how long it will take to get there. That is what makes trading so much more difficult than technical analysis. It is at these junctures that you find yourself looking for a bridge to take you from being a successful technical analyst to being a successful trader. Happy trading!
Vikram Murarka is chief currency strategist of Kshitij.com. He may be reached via email at Vikram@Kshitij.com.
Suggested reading
Murarka, Vikram [2005]. "Fundamentals & Technicals, Together
Again," Technical Analysis of Stocks & Commodities, Volume 23: January.
--eSignal
Return to September 2005 Contents