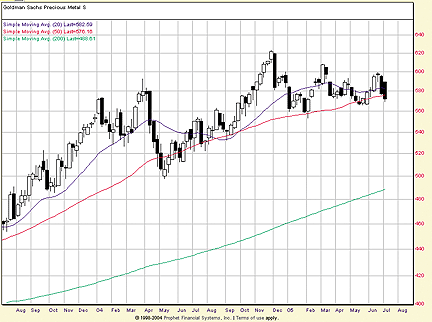
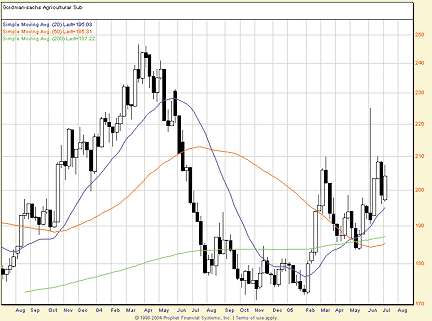
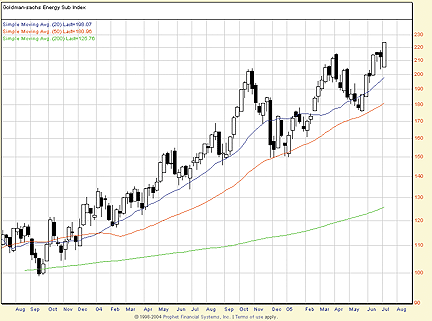
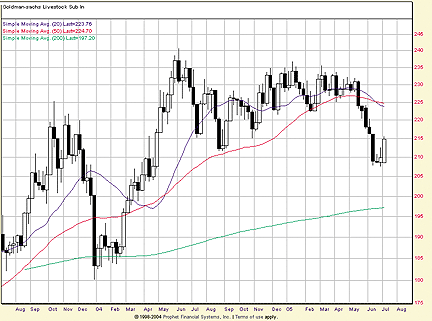
The Goldman Sachs Commodities Index (GSCI) is a world-production weighted index of commodity prices based on the average quantity of production for the last five years of available data. In addition to being a benchmark against which commodity price performance can be judged, the subgroups of the GSCI are equally reliable measures of the price performance of the various commodities that make up the GSCI. The provided weekly charts of these subgroups include both the 20- and 50-period moving averages.
GOLDMAN SACHS COMMODITIES INDEX (GSCI) SUBGROUP - PRECIOUS METALS ($GPX)

The GSCI Precious Metals subgroup includes both gold and silver.
The bull market in precious metals intensified in 2004 after a correction that saw the group slip from their early spring highs. By the summer of 2004, however, precious metals had gotten their groove back, and went on to notch higher highs by fall. The correction that followed these late 2004 highs has been stickier than the one that befell $GPX a year previous, insofar as the index has slipped into a sideways consolidation, rather than the sort of post-correction rally of a year ago.
What they say: "The independence of gold in the different currencies does not mean that gold will move against all currencies at once. No, each different gold market faces different facets of the global problems that are now building up so will react to the gold price in their own situation in their own currency and not be driven by the (dollar) price of gold in isolation. For instance, when the (euro) falls, Europeans will buy gold, irrespective of the (dollar) price, as they are concerned with their own (euro) saving and investments." - Julian D.W. Phillips, "Gold-The Weekly Global Perspective" Gold-Authentic Money at Authenticmoney.com, July 5, 2005.
GOLDMAN SACHS COMMODITIES INDEX (GSCI) SUBGROUP - AGRICULTURE ($GKX)

The GSCI Agriculture subgroup includes those commodities typically referred to as "the grains," and many commodities generally included in the "softs" category. The subgroup's components include: wheat, red wheat, corn, soybeans, cotton, sugar, coffee, cocoa, and orange juice.
Recent dramatic moves in many of the grains come in the wake of a sharp bear market in the commodities index subgroup, as shown by the declines from the summer of 2004 to the bottom that began to form in the fall of that year. Since that time, agricultural commodities have staged a sharp rally, one that has already retraced more than a third of the previous decline. With the 20-, 50- and 200-week simple moving averages below the $GKX rather than above it, the advance in this group stands a better than even chance of moving agricultural prices higher in the near term.
What they say: "The White House is asking Congress to eliminate a cotton subsidy program that might otherwise spark a trade war with Brazil. After hearing a complaint from Brazil, which contends US subsidies hurt its burgeoning cotton exports, the World Trade Organization found in March that US assistance to cotton farmers distorted world prices by encouraging overproduction. Ending subsidies of cotton sales to fabric mills and exporters would bring the United States into compliance with the Wto ruling, said U.S. Agriculture Secretary Mike Johanns." - "US Seeks End to its Cotton Subsidies," United Press International, July 6, 2005.
GOLDMAN SACHS COMMODITIES INDEX (GSCI) SUBGROUP - ENERGIES ($GJX)

The GSCI Energies subgroup includes crude oil, brent crude oil, unleaded gasoline, heating oil, and natural gas.
Save for sharp corrections in the fall of 2004 and again during the spring of 2005, the energies subgroup has continued to outperform other commodities over the past few years. Not only has each of the two corrections found support on the 50-week simple moving average, but also the most recent moves in $GJX have actually vaulted the index into new high territory, besting the March/April highs of earlier in 2005.
What they say: "Crude oil, after reaching a record $62.10 a barrel in New York, plunged as terrorist bombs that killed at least 37 people in London raised the possibility of an economic slowdown. It was the biggest price swing in 14 years. Prices reached their peak at about 5 a.m. New York time amid concern that Hurricane Dennis will reach the Gulf of Mexico and disrupt production as Ivan did last November. A report showing rising US supplies of distillate fuels, a category that includes heating oil and diesel, helped push prices lower, along with the terrorist attack." - "Oil Falls From Record as London Blasts Threaten Economic Growth," Bloomberg News, July 7, 2005.
GOLDMAN SACHS COMMODITIES INDEX (GSCI) SUBGROUP - LIVESTOCK ($GVX)

The GSCI Livestock subgroup includes both live and feeder cattle, as well as lean hogs.
After soaring in early 2004, the livestock subgroup slipped into a horizontal consolidation that lasted from the summer of 2004 into the late spring of 2005. Unfortunately for livestock longs, $GVXx fell below both its 20- and 50-week moving averages in May 2005 and have moved sharply lower since. Finding support midway between its 20- and 50-week moving averages above and its 200-week moving average below, $GVX is at a critical juncture between bounding higher and extending its already significant losses.
What they say: "The threat of mad cow's disease continues to vet health inspectors, tilt the beef trade industry and strain international trade relations with the Far East. The tension was heightened in recent days when the United States Agricultural Department announced that a second case of bovine spongiform encephalopathy, or mad cow's disease, was confirmed after two conflicting tests results ... 'I am encouraged that our interlocking safeguards are working exactly as intended,' Johanns said at a news conference. 'This animal was blocked from entering the food supply because of the firewalls we have in place. Americans have every reason to continue to be confident in the safety of our beef.'" - "USDA Confirms Second Case of BSE," Western Farm Press, July 7, 2005.
-- Prophet Financial Systems-- See Editorial Resource Index
Excerpted from an article originally published in the September 2005 issue of Technical Analysis of STOCKS & COMMODITIES magazine. All rights reserved. © Copyright 2005, Technical Analysis, Inc.
Return to September 2005 Contents