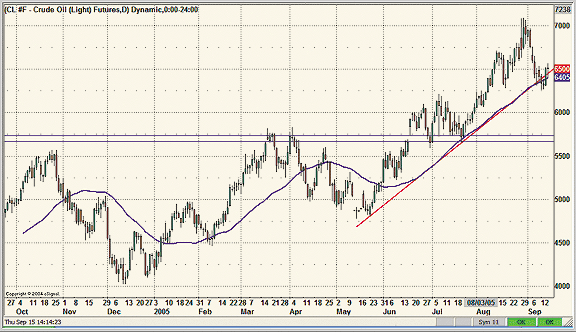
For reasons that are obvious (think prices at the gas pump if you're confused), I have been watching the action in the crude oil market recently. Given that I haven't seen prices come down that much at the gas pumps, I thought I'd pull up a chart of the continuous crude oil contracts to see where things were heading. I'm not trading crude oil contracts but thought I'd share my observations. Usually, I overlay a 50-period moving average but in this case, I thought a shorter period would fit better. I applied the 40-day moving average to the daily chart of the crude oil continuous contracts, since it seemed to closely correlate with the trendline displayed in Figure 1. If you look at the current action (as of September 16, 2005), you will see some interesting behavior, in terms of the trendline and moving average displayed.
The price of crude hit a high and then slid down to the 40-day moving average. As I write this, it is hesitating at that level, deciding whether it wants to go lower or higher. The same can be said with respect to the trendline. Prices broke below it and are now moving back up to the trendline and looking as if they want to break above it. Will they? That remains to be seen, although I personally hope they slide down to the next support level.
Let's look at where that support level might be.

FIGURE 1: CONTINUOUS CRUDE OIL CONTRACTS. Crude prices hit a high and then slid down to the 40-day moving average.
It's actually clearly visible. On Figure 1, it's the area between the two horizontal lines. If you go back in time on the chart, you'll see that several scenarios took place between these levels. In late June and July, two lows, or pullbacks of the current trend, hit this level. In mid-June, this area marked a price gap. If you go back to mid-March and early April, you'll see that there was a double top in which both tops hit this area. Given these series of events, I would say this is a strong support level. Perhaps prices will drop to this support level...I'm keeping my fingers crossed. Once that moving average starts sloping downward, I'll be more optimistic.
-Jayanthi Gopalakrishnan, Editor
Originally published in the November 2005 issue of Technical Analysis of STOCKS & COMMODITIES magazine. All rights reserved. © Copyright 2005, Technical Analysis, Inc.
Return to November 2005 Contents