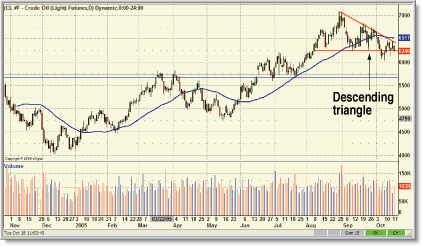
Continuing from last month's look at crude oil contracts, we did experience some easing in crude oil prices. The 40-day moving average turned down, the upward sloping trendline broke, and up until now, prices have been below the 40-day moving average. But they have yet to reach the levels I mentioned in my column last month. If you look at the chart of crude oil contracts in Figure 1, you see there was a sharp decline in prices followed by a pullback. Will prices move back up to the moving average, or will they continue falling?

FIGURE 1: DESCENDING TRIANGLES AND DOWNSIDE BREAKOUTS. Will we see a powerful move in crude oil? The answer will be based on the strength of that downside breakout.
To answer that question, I looked for other chart formations that have taken place since I last commented on crude oil charts. After I got to the descending triangle that has just about completed, it became clear to me that prices are moving downward. It's really a question of how strong that downward breakout is, and you can determine that by looking at volume, which is why I brought up the volume chart.
Typically, breakouts occur on high volume. Then again, downside breakouts have been known to occur on low volume. Looking at Figure 1, I would be more convinced of a further decline if the downside breakout occurred on high volume. For example, on October 6, 2005, prices broke below that triangle bottom on a relatively wide range day. However, volume was low, and on the following trading day, even though the price range was small, volume was higher. Clearly, the selling that took place on October 6, 2005, wasn't enough to take prices further down. This suggests there is more interest in buying than selling.
So if you do see a downside breakout occur with conviction, you can expect prices to move lower very quickly. We're not talking about a gradual trend reversal here. Usually, prices will drop to the level that is the distance between the high and low point of the triangle. In this case, it could drop to around $54.50. This is a little lower than the level I had forecast in my last column. This is what you can expect, theoretically.
But in reality there is always the possibility of a failure, and from
Tom Bulkowski's Encyclopedia Of Chart Patterns, we know that the
failure rate for triangles is 45%, but after a downside breakout that rate
is 4%. How will this chart pan out? It'll be interesting to see.
-Jayanthi Gopalakrishnan, Editor
SUGGESTED READING
Bulkowski, Thomas [2000]. Encyclopedia Of Chart Patterns, John
Wiley & Sons.
Originally published in the December 2005 issue of Technical Analysis of STOCKS & COMMODITIES magazine. All rights reserved. © Copyright 2005, Technical Analysis, Inc.
Return to December 2005 Contents