Adding An Algorithm To Your Analytical Arsenal
Identifying The Cup (With Or Without The Handle)
by Giorgos Siligardos, Ph.D.
The rounding bottom (also known as the cup) is one of the basic and most-familiar bullish charting formations. In this article I will present a simple yet powerful and flexible algorithm to identify cups that can be implemented in almost all technical analysis software and in all time frames.
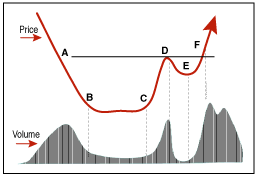
The typical cup formation can be seen in Figure 1. The price declines and stops at point B. A sideways price movement follows, accompanied by low volume (the period from points B to C). The price then advances and stops at point D. With that, a cup-like price formation forms. Many times (though not necessarily), after point D the price declines again for a while on very low volume (point E) and forms the "handle" of the cup. Then the price breaks upward with the short-term horizontal resistance defined by point D on very high volume, and a medium-long term bullish period begins.
A variation of the cup is what technician Steve Nison refers to in his Japanese Candlestick Charting Techniques as "tower bottoms." The typical cup formation takes many weeks (or even months or years) to complete, whereas a tower bottom formation takes a shorter time to form. The segments A-B and C-D are steeper and the bottom period (from B to C) is more volatile. Nevertheless, the similarity between tower bottoms and the typical cups is very strong, so when the bottom part of a tower bottom is not very volatile, I categorized it in the general family of cup formations.

FIGURE 1: A TEXTBOOK CUP WITH HANDLE. This is the typical "cup with handle" pattern.
...Continued in the February issue of Technical Analysis of STOCKS
& COMMODITIES
Excerpted from an article originally published in the February 2006 issue of Technical Analysis of STOCKS & COMMODITIES magazine. All rights reserved. © Copyright 2006, Technical Analysis, Inc.
Return to February 2006 Contents