February 2006
TRADERS' TIPS
You can copy these formulas and programs for easy use in your spreadsheet or analysis software. Simply "select" the desired text by highlighting as you would in any word processing program, then use your standard key command for copy or choose "copy" from the browser menu. The copied text can then be "pasted" into any open spreadsheet or other software by selecting an insertion point and executing a paste command. By toggling back and forth between an application window and the open Web page, data can be transferred with ease.
This month's tips include formulas and programs for:
TRADESTATION: SELF-ADJUSTING RSI
or return to February 2006 Contents
TRADESTATION: SELF-ADJUSTING RSI
David Sepiashvili's article, "The Self-Adjusting RSI," presents a technique to adjust the traditional RSI overbought and oversold thresholds so as to ensure that 70-80% of RSI values lie between the two thresholds. Sepiashvili presents two algorithms for adjusting the thresholds. One is based on standard deviation, the other on a simple moving average of the RSI. No explicit technique to ensure the 70-80% conformance is presented.
Both threshold adjustment options are available in the following indicator code. The algorithm used depends on the user's setting of the "type" input. All together, three sets of EasyLanguage code are provided here: the basic self-adjusted RSI indicator; a tool for ensuring the 70-80% conformance is achieved; and a simple strategy. To download this code, search for the file "SelfAdjRsi.eld" in the "TradeStation and EasyLanguage Support" discussion forum at the TradeStation Support Center at https://www.TradeStation.com.
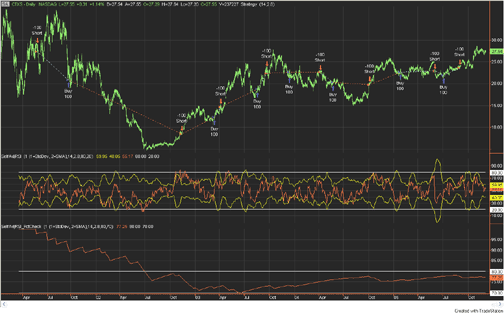
FIGURE 1: TRADESTATION, SELF-ADJUSTING RSI. Subgraph
1 (top of chart) contains CTXS daily bars. The trades shown are generated
by the strategy "SelfAdjRSI." Directly beneath the price bars in subgraph
2 is the SelfAdjRSI indicator. Subgraph 3 shows the percent of RSI values
that lie between the "SelfAdjusted" RSI thresholds.
Indicator:   _SelfAdjRSI
inputs:
 Type( 1 ), { Enter 1 for StdDev, 2 for SMA }
 Length( 14 ),
 K( 2.8 ),
 StdOverBought( 80 ),
 StdOverSold( 20 ) ;
variables:
 MyRSI( 0 ),
 AvgMyRSI( 0 ),
 KAbsAvg( 0 ),
 OverBought( 0 ),
 OverSold( 0 ),
 KSDMyRSI( 0 ) ;
MyRSI = RSI( Close, Length ) ;
if Type = 1 then
 begin
 AvgMyRSI = Average( MyRSI, Length ) ;
 KAbsAvg = K * Average( AbsValue( MyRSI - AvgMyRSI ),
  Length ) ;
 OverBought = 50 + KAbsAvg ;
 OverSold = 50 - KAbsAvg ;
 end
else
 begin
 KSDMyRSI = K * StdDev( MyRSI, Length ) ;
 OverBought = 50 + KSDMyRSI ;
 OverSold = 50 - KSDMyRSI ;
 end ;
if CurrentBar > 3 * Length then { starting-point
 dependent calculations complete }
 begin
 Plot1( OverBought, "OverBought" ) ;
 Plot2( OverSold, "Oversold" ) ;
 Plot3( MyRSI, "RSI" ) ;
 Plot4( StdOverBought, "OB" ) ;
 Plot5( StdOverSold, "OS" ) ;
 end ;
Indicator:   _SelfAdjRSI_PctCheck
inputs:
 Type( 1 ), { Enter 1 for StdDev, 2 for SMA }
 Length( 14 ),
 K( 2 ),
 UpperGoal( 80 ),
 LowerGoal( 70 ) ;
variables:
 MyRSI( 0 ),
 AvgMyRSI( 0 ),
 KAbsAvg( 0 ),
 OverBought( 0 ),
 OverSold( 0 ),
 KSDMyRSI( 0 ),
 TripleLength( 0 ),
 Count( 0 ),
 PctCheck( 0 ) ;
MyRSI = RSI(Close,Length) ;
if Type = 1 then
 begin
 AvgMyRSI = Average( MyRSI, Length ) ;
 KAbsAvg = K * Average( AbsValue( MyRSI - AvgMyRSI ),
  Length ) ;
 OverBought = 50 + KAbsAvg ;
 OverSold = 50 - KAbsAvg ;
 end
else
 begin
 KSDMyRSI = K * StdDev( MyRSI, Length ) ;
 OverBought = 50 + KSDMyRSI ;
 OverSold = 50 - KSDMyRSI ;
 end ;
TripleLength = 3 * Length ;
if CurrentBar > TripleLength then { starting-point
 dependent calculations complete }
 begin
 if MyRSI > OverSold and MyRSI < OverBought then
  Count = Count + 1 ;
 PctCheck = Count / ( CurrentBar - TripleLength ) * 100 ;
 Plot1( PctCheck, "PctCheck" ) ;
 Plot2( UpperGoal, "UpperGoal" ) ;
 Plot3( LowerGoal, "LowerGoal" ) ;
 end ;
Strategy:   _SelfAdjRSI
inputs:
 Length( 14 ),
 K( 2 ) ;
variables:
 MyRSI( 0 ),
 KSDMyRSI( 0 ),
 OverBought( 0 ),
 OverSold( 0 ) ;
MyRSI = RSI( Close, Length ) ;
KSDMyRSI = K * StdDev( MyRSI, Length ) ;
OverBought = 50 + KSDMyRSI ;
OverSold = 50 - KSDMyRSI ;
if MyRSI crosses over OverSold then
 Buy next bar market ;
if MyRSI crosses under OverBought then
 Sell short next bar at market ;
--Mark MillsGO BACK
TradeStation Securities, Inc.
A subsidiary of TradeStation Group, Inc.
www.TradeStationWorld.com
METASTOCK: SELF-ADJUSTING RSI
David Sepiashvili's article, "The Self-Adjusting RSI," describes two methods of adjusting the width of the overbought and oversold bands for the RSI.
Both of these methods have been incorporated into a single MetaStock indicator. This formula will prompt for the length of the RSI; the constants used to calculate the bands; and the method to calculate the bands.
To enter this indicator into MetaStock:
1. In the Tools menu, select Indicator Builder.2. Click New to open the Indicator Editor for a new indicator.
3. Type the name of the formula.
4. Click in the larger window and type in the following formula:
Name:  Self-Adjusting RSI
Formula:
x:=Input("number of periods for RSI",1,2000,14);
k1:=Input("standard deviation constant",0.1,5,1.8);
c1:=Input("SMA constant",0.1,5,2);
m1:=Input("method <1=SD/2=SMA>",1,2,1);
top:=If(m1=1,
50+(k1*Stdev(RSI(x),x)),
50+(c1*Mov(Abs(RSI(x)-Mov(RSI(x),x,S)),x,S)));
bottom:=If(m1=1,
50-(k1*Stdev(RSI(x),x)),
50-(c1*Mov(Abs(RSI(x)-Mov(RSI(x),x,S)),x,S)));
RSI(x);
top;
bottom
5. Click OK to close the Indicator Editor.
--William GolsonGO BACK
MetaStock Support Representative
Equis International (A Reuters Company)
801 265-9998, www.metastock.com
WEALTH-LAB: SELF-ADJUSTING RSI
Visit www.wealth-lab.com to try out this month's ChartScript adaptation by searching the public ChartScript titles for the words "self-adjusting RSI," and then entering a symbol of your choice. The ChartScript trading system is available to all Wealth-Lab Pro and Developer users via the Community|Download ChartScripts action.
The Chartscript provided uses the traditional RSI rules, going long when the RSI indicator crosses over its lower benchmark and exiting when it crosses below the upper benchmark. Lower and upper benchmarks are calculated in lines 10-14 of the script according to the article's explanation. Similar to the example presented in the article, we use a period n of 50 days and a multiplier c of 2 (Figure 2).
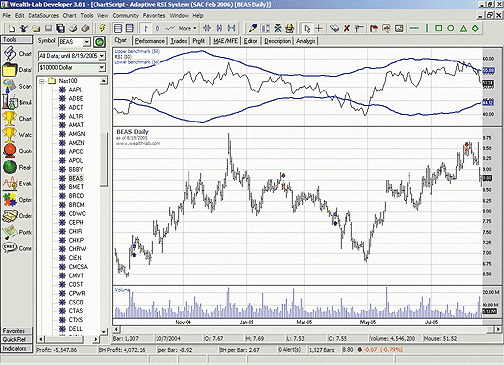
FIGURE 2: WEALTH-LAB, SELF-ADJUSTING RSI. The adaptive benchmarks used for entry/exit signals (shown as blue lines in the RSI pane) change according to the RSI volatility. The system performs well with Bea Systems (BEAS) during the test period shown.
var bar, rsi1, upper, lower, rsipane: integer;
const n = 50;  //Period for RSI
const c = 2;   //Multiplier
//Creating indicator
rsi1 := RSISeries(#Close,n);
//Creating upper/lower benchmarks
upper := SMASeries(ABSSeries(SubtractSeries(RSISeries(#Close,n),SMASeries(RSISeries(#Close,n),n))),n);
upper := MultiplyseriesValue(upper,c);
lower := MultiplySeriesValue(upper,-1);
upper := AddSeriesValue(upper,50);
lower := AddSeriesValue(lower,50);
// Charting
rsipane := CreatePane(100, true, true);
PlotSeriesLabel(upper, rsipane,#blue,#thick,'Upper benchmark ('+inttostr(n)+')');
PlotSeriesLabel(rsi1, rsipane,#black,#thin,'RSI ('+inttostr(n)+')');
PlotSeriesLabel(lower, rsipane,#blue,#thick,'Lower benchmark ('+inttostr(n)+')');
for Bar := n*3 to BarCount - 1 do //n*3 is needed to stabilize the RSI indicator
begin
  if not LastPositionActive then
  begin
    if CrossOver(Bar, rsi1, lower) then
      BuyAtMarket(Bar+1, 'Long');
  end
  else if CrossUnder(Bar, rsi1, upper) then
    SellAtMarket(Bar+1, LastPosition, 'Exit Long');
end;
-- José Cruset
www.wealth-lab.com
AMIBROKER: SELF-ADJUSTING RSI
In "The Self-Adjusting RSI," author David Sepiashvili presents an idea for using dynamic overbought/oversold zones with the classic RSI indicator. Implementing dynamic self-adjusting benchmark lines is easy and straightforward in AmiBroker's Formula Language. Ready-to-use code is provided in the Listing 1. After applying the indicator, the parameter window can be used to control the parameters such as averaging period. A sample chart is shown in Figure 3.
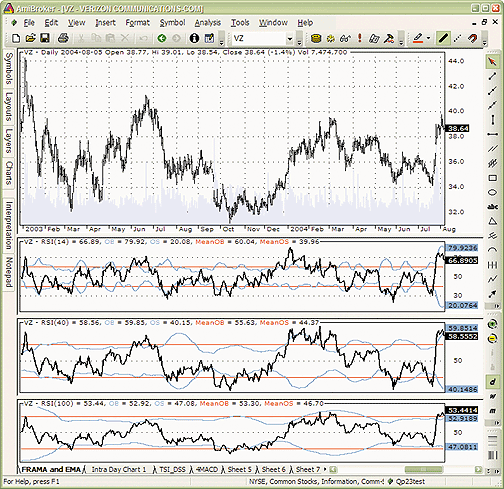
FIGURE 3: AMIBROKER, SELF-ADJUSTING RSI. Here is a daily chart of Verizon (VZ) with a set of RSI indicators plotted using different periods along with self-adjusting benchmarks.
LISTING 1
p = Param("Periods", 14, 2, 100, 1 );
r = RSI( p );
w = 1.8 * StDev( r, p );
Plot( r, "RSI(" + p +")", colorBlack, styleThick );
Plot( 50 + w, "OB", colorLightBlue, styleThick );
Plot( 50 - w, "OS", colorLightBlue, styleThick );
allbars = LastValue( Cum(1) ) - 2 * p - 1;
Plot( LastValue( MA( 50 + w, allbars ) ), "MeanOB",
      colorRed, styleNoLabel );
Plot( LastValue( MA( 50 - w, allbars ) ), "MeanOS",
      colorRed, styleNoLabel  );
This code is also available at www.Traders.com or www.amibroker.com/members/.
--Tomasz Janeczko, AmiBroker.com
www.amibroker.com
eSIGNAL: SELF-ADJUSTING RSI
For this month's article by David Sepiashvili, "The Self-Adjusting RSI," we've provided the following eSignal formula, named "SelfAdjRSI.efs." The study plots the standard RSI and the self-adjusting RSI overbought-oversold benchmarks (Figure 4).
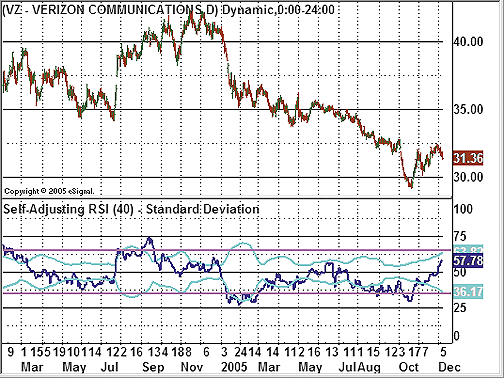
FIGURE 4: eSIGNAL, RSI AND SELF-ADJUSTING RSI. This plots the standard RSI and the self-adjusting RSI overbought-oversold benchmarks.
Through the Edit Studies option in the Advanced Chart, there are
several study parameters that may be customized. The study parameters allow
you to set the number of periods for the RSI, the adjustment type (standard
deviation or smoothed absolute deviation), as well as the k and c values
for the respective adjustment types.
To discuss this study or download a complete copy of the formula, please
visit the EFS Library Discussion Board forum under the Bulletin Boards
link at https://www.esignalcentral.com. The eSignal formula script (EFS)
is also available for copying and pasting from the STOCKS & COMMODITIES
website at Traders.com.
/***************************************
Provided By : eSignal (c) Copyright 2005
Description:  Self-Adjusting RSI - by David Sepiashvili
Version 1.0  12/07/2005
Notes:
February 2006 Issue of Stocks and Commodities Magazine
* Study requires version 7.9 or higher.
Formula Parameters:                 Defaults:
RSI Periods                         14
Adjustment Type                     Standard Deviation
    [Standard Deviation,
     Smoothed Abs Deviation]
k Value (Standard Deviation)        1.8
c Value (Smoothed Abs Deviation)    2.0
***************************************/
function preMain() {
    setStudyTitle("Self-Adjusting RSI ");
    setShowTitleParameters(false);
    setCursorLabelName("SA Upper", 0);
    setCursorLabelName("RSI", 1);
    setCursorLabelName("SA Lower", 2);
    setDefaultBarThickness(2, 0);
    setDefaultBarThickness(2, 1);
    setDefaultBarThickness(2, 2);
    setDefaultBarFgColor(Color.aqua, 0);
    setDefaultBarFgColor(Color.navy, 1);
    setDefaultBarFgColor(Color.aqua, 2);
    addBand(65, PS_SOLID, 2, Color.magenta, "upper");
    addBand(35, PS_SOLID, 2, Color.magenta, "lower");
    setStudyMax(100);
    setStudyMin(0);

    var fp1 = new FunctionParameter("nRSIlen", FunctionParameter.NUMBER);
        fp1.setName("RSI Periods");
        fp1.setDefault(14);
    var fp2 = new FunctionParameter("sType", FunctionParameter.STRING);
        fp2.setName("Adjustment Type");
        fp2.addOption("Standard Deviation");
        fp2.addOption("Smoothed Abs Deviation");
        fp2.setDefault("Standard Deviation");
    var fp3 = new FunctionParameter("nK", FunctionParameter.NUMBER);
        fp3.setName("k Value (Standard)");
        fp3.setLowerLimit(0);
        fp3.setDefault(1.8);
    var fp4 = new FunctionParameter("nC", FunctionParameter.NUMBER);
        fp4.setName("c Value (Smoothed Abs)");
        fp4.setLowerLimit(0);
        fp4.setDefault(2);
}
var bVersion = null;
var bInit    = false;
var xRSI     = null;
var xSource  = null;
function main(nRSIlen, sType, nK, nC) {
    if (bVersion == null) bVersion = verify();
    if (bVersion == false) return;

    var nUpper = null;
    var nLower = null;

    if (bInit == false) {
        setStudyTitle("Self-Adjusting RSI (" + nRSIlen + ") - " + sType);
        //xRSI = rsi(nRSIlen);  // Enhanced RSI
        xRSI = efsInternal("StandardRSI", nRSIlen);
        xSource = efsInternal("calcSource", nRSIlen, xRSI);
        bInit = true;
    }

    if (sType == "Standard Deviation") {
        var nStdev = SD(nRSIlen);
        nUpper = 50 + (nK * nStdev);
        nLower = 50 - (nK * nStdev);
    } else if (sType == "Smoothed Abs Deviation") {
        nUpper = 50 + (nC * sma(nRSIlen, getSeries(xSource)));
        nLower = 50 - (nC * sma(nRSIlen, getSeries(xSource)));
    }

    return new Array(nUpper, xRSI.getValue(0), nLower);
}
/***** Support Functions *****/
function verify() {
    var b = false;
    if (getBuildNumber() < 700) {
        drawTextAbsolute(5, 35, "This study requires version 7.9 or later.",
            Color.white, Color.blue, Text.RELATIVETOBOTTOM|Text.RELATIVETOLEFT|Text.BOLD|Text.LEFT,
            null, 13, "error");
        drawTextAbsolute(5, 20, "Click HERE to upgrade.@URL=https://www.esignal.com/download/default.asp",
            Color.white, Color.blue, Text.RELATIVETOBOTTOM|Text.RELATIVETOLEFT|Text.BOLD|Text.LEFT,
            null, 13, "upgrade");
        return b;
    } else {
        b = true;
    }

    return b;
}
function SD(nLength) {
    var sumX = 0;
    var sumX2 = 0;
    for (i = 0; i < nLength; ++i) {
        sumX += xRSI.getValue(-i);
        sumX2 += (xRSI.getValue(-i) * xRSI.getValue(-i))
    }
    var meanX = (sumX/nLength);
    var stdev = Math.sqrt((sumX2/nLength) - (meanX*meanX));
    return stdev;
}
var xSma = null;
function calcSource(n, x) {
    if (xSma == null) xSma = sma(n, x);
    return Math.abs( x.getValue(0) - xSma.getValue(0) );
}
function StandardRSI(nInputLength) {
    var nLength = nInputLength;
    var vValue;
    var vLastClose;
    var vSumUp = 0.0;
    var vSumDown = 0.0;
    var i;
    var vRS;
    var v;

    vValue = getValue("Close", 0, -(nLength+1));
    if(vValue == null)
        return;
    var cntr = 0;
    vLastClose = vValue[nLength];
    for(i = nLength-1; i>= 0; i--) {
       v = vValue[i];
        if(v > vLastClose) {
            vSumUp += v - vLastClose;
        } else if(v < vLastClose) {
            vSumDown += vLastClose - v;
        }
        vLastClose = v;
    }
    vSumUp /= nLength;
    vSumDown /= nLength;
    vRS = 1 + (vSumUp / vSumDown);
    vValue = 100 - (100 / vRS);
    return (vValue);
}
--Jason Keck
eSignal, a division of Interactive Data Corp.
800 815-8256, www.esignalcentral.com
NEUROSHELL TRADER: SELF-ADJUSTING RSI
The self-adjusting RSI indicator described by David Sepiashvili in his article in this issue can be easily implemented in NeuroShell Trader by combining a few of NeuroShell Trader's 800+ indicators.
To implement the overbought and oversold benchmarks (see Figure 5), select "New Indicator " from the Insert menu and use the Indicator Wizard to create the following indicators:
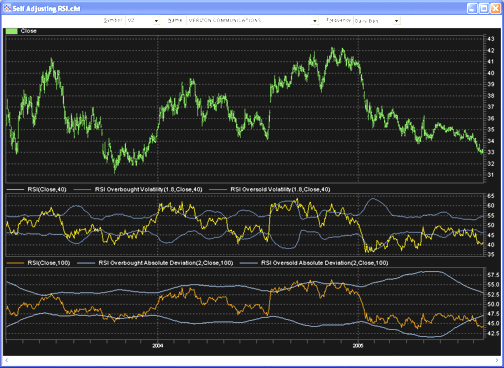
FIGURE 5: NEUROSHELL, SELF-ADJUSTING RSI. Here is a sample NeuroShell chart demonstrating the self-adjusting RSI.
RSI Overbought Volatility Benchmark
     Add2( 50, Mult2( 1.8, StndDev( RSI( Close, N ), N ) ) )
RSI Oversold Volatility Benchmark
     Subtract( 50, Mult2( 1.8, StndDev( RSI( Close, N ), N ) ) )
RSI Overbought Absolute Deviation Benchmark
     Add2( 50, Mult2( 2.0, MovAvg( Abs( Subtract( RSI( Close, N ), MovAvg( RSI( Close, N ), N )))))
RSI Oversold Absolute Deviation Benchmark
     Subtract( 50, Mult2( 2.0, MovAvg( Abs( Subtract( RSI( Close, N ), MovAvg( RSI( Close, N ), N )))))
For more information on NeuroShell Trader, visit https://www.NeuroShell.com.
--Marge Sherald, Ward Systems Group, Inc.GO BACK
301 662-7950, sales@wardsystems.com
www.neuroshell.com
INVESTOR/RT: SELF-ADJUSTING RSI
The overbought and oversold benchmarks involved in the self-adjusting
RSI, as described by David Sepiashvili in his article in this issue, can
be implemented in Investor/RT as custom indicators with the following syntax:
Overbought Benchmark
50 + 1.8 * STD(RSI, 14)
Oversold Benchmark
50 - 1.8 * STD(RSI, 14)
Figure 6 shows a 14-period RSI in red in the second pane. The overbought
and oversold benchmarks overlay the RSI and are drawn in blue.
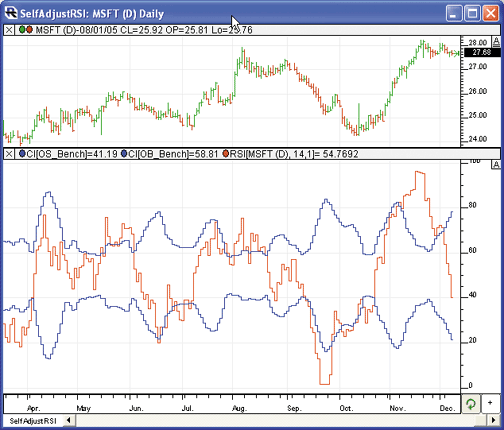
FIGURE 6: INVESTOR/RT, RSI WITH BENCHMARKS. This Investor/RT daily bar chart of MSFT displays the RSI indicator in red overlaid with blue lines representing the overbought (upper) and oversold (lower) benchmarks.
GO BACK
--Chad Payne, Linn Software
info@linnsoft.com, www.linnsoft.com
AIQ SYSTEMS: SELF-ADJUSTING RSI
The AIQ code is given below for the two versions of David Sepiashvili's self-adjusting RSI. To test the effectiveness of the self-adjusting overbought and oversold bands, I created a classic RSI entry rule as follows:
Enter a long position if:
1. Yesterday the 14-day RSI is below the oversold
benchmark, and
2. Today the 14-day RSI is above the oversold
benchmark.
Exit all long positions after five trading days.
Enter a short position if:
1. Yesterday the 14-day RSI is above the overbought
benchmark, and
2. Today the 14-day RSI is below the overbought
benchmark.
Exit all short positions after five trading days.
The long entries were tested during a bullish-to-sideways period of 10/15/2002 to 12/06/2005 using the NASDAQ 100 stock list. The key statistics from this test are summarized in Table 1:
For the short test, I used the bearish period from 9/01/2000 to 10/15/2002 using the NASDAQ 100 stock list. The key statistics from this test are summarized in Table 2:
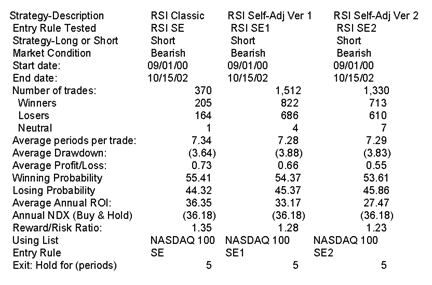
Neither version 1 nor version 2 of the self-adjusting RSI was able to outperform the classic RSI short entry rule. It appears that the constants K and C need to be increased for the short entry rule. We did not perform further tests to optimize the K and C parameters.
The AIQ code for the self-adjusting RSI follows. This can also be downloaded
from the AIQ website at https://www.aiqsystems.com/S&C1.htm.
GO BACKAIQ Code ! SELF-ADJUSTING RSI ! Author: David Sepiashvili, TASC February 2006 ! Coded by; Richard Denning 12/07/2005 ! CLASSIC WELLS WILDER RSI: ! DEFINE THE RSI PARAMETER: W1 is 14. ! FORMULA TO CONVERT WILDER TYPE RECURSIVE ! AVERAGING TO EXPONENTIAL AVERAGING: ! ExponentialPeriods = 2 * WilderPeriod - 1. L1 is 2 * W1 - 1. ! RSI FORMULA: Price is [close]. U is Price - valresult(Price,1). D is valresult(Price,1)-Price. AvgU is ExpAvg(iff(U>0,U,0),L1). AvgD is ExpAvg(iff(D>=0,D,0),L1). RSI is 100-(100/(1+(AvgU/AvgD))). ! SELF-ADJUSTING BANDS FOR OVERBOUGHT ! AND OVERSOLD LEVELS: ! VERSION 1: SD is sqrt(variance(RSI,W1)). K is 1.8. OB1 is 50 + K * SD. OS1 is 50 - K * SD. ! VERSION 2: C is 2.0. SMArsi is simpleavg(RSI,W1). OB2 is 50 + C * simpleavg(abs(RSI - SMArsi),W1). OS2 is 50 - C * simpleavg(abs(RSI - SMArsi),W1). ! ENTRY RULES FOR TEST OF INDICATORS: ! CLASSIC RSI ENTRY RULES: LC if RSI < 30. HC if RSI > 70. LE if valrule(LC,1) and not LC. SE if valrule(HC,1) and not HC. ! SELF-ADJUSTING RSI VERSION 1: LC1 if RSI < OS1. HC1 if RSI > OB1. LE1 if valrule(LC1,1) and not LC1. SE1 if valrule(HC1,1) and not HC1. ! SELF-ADJUSTING RSI VERSION 2: LC2 if RSI < OS2. HC2 if RSI > OB2. LE2 if valrule(LC2,1) and not LC2. SE2 if valrule(HC2,1) and not HC2.
--Richard Denning
Aiq Systems
richard.denning@earthlink.net
TRADING SOLUTIONS: SELF-ADJUSTING RSI
In his article "The Self-Adjusting RSI," David Sepiashvili provides two methods for adjusting the benchmarks used with the relative strength index: one based on the standard deviation (SD) of recent RSI values, and one based on the smoothed absolute deviation (SAD).
These functions can be entered into TradingSolutions as described below. This is also available as a function file that can be downloaded from the TradingSolutions website (https://www.tradingsolutions.com) in the Solution Library section. As with many indicators, these functions could make good inputs to neural network predictions. In this case, they would typically be combined with the Rsi.
Function Name: Self-Adjusting RSI Overbought Benchmark (SD)
Short Name: SARSI+SD
Inputs: Data, Period, Multiplier (1.8)
Add (50, Mult (Multiplier, StDev (RSI (Data, Period), Period)))
Function Name: Self-Adjusting RSI Oversold Benchmark (SD)
Short Name: SARSI-SD
Inputs: Data, Period, Multiplier (1.8)
Subtract (50, Mult (Multiplier, StDev (RSI (Data, Period), Period)))
Function Name: Self-Adjusting RSI Overbought Benchmark (SAD)
Short Name: SARSI+SAD
Inputs: Data, Period, Multiplier (2.0)
Add (50, Mult (Multiplier, MA (Abs (Sub (RSI (Data, Period), MA (RSI (Data, Period), Period))), Period)))
Function Name: Self-Adjusting RSI Oversold Benchmark (SAD)
Short Name: SARSI-SAD
Inputs: Data, Period, Multiplier (2.0)
Subtract (50, Mult (Multiplier, MA (Abs (Sub (RSI (Data, Period), MA (RSI (Data, Period), Period))), Period)))
--Gary Geniesse
NeuroDimension, Inc.
800 634-3327, 352 377-5144
www.tradingsolutions.com
TRADE NAVIGATOR: SELF-ADJUSTING RSI IN TRADESENSE
In Trade Navigator Gold and Platinum versions, you can create custom functions to display on the chart as indicators. In this way, you can add your own indicators to the indicators already provided in Trade Navigator or you can add indicators from traders who have provided formulas for their indicators in books or magazines.
The TradeSense formula to create the self-adjusting RSI indicator as
described by David Sepiashvili requires you to create four functions. We
will call the indicators self adjusting RSI k oversold; self adjusting
Rsi k overbought; self adjusting RSI c oversold; and self adjusting RSI
c overbought. The number of days to use can be edited for each of these
indicators by simply changing the "bars in average" on the Chart Settings
window. To add the self-adjusting RSI indicators to the list of indicators
in Trade Navigator, follow these steps:
Self-adjusting RSI k oversold
(1) Go to the Edit menu and click on Functions. This will bring up the Trader's Toolbox already set to the Functions tab.
(2) Click on the New button.
(3) Type the formula (Std Devs As Value (RSI (Close , bars in average , False) , bars in average , -1.8)) into the Function window (Figure 7). By setting bars in average as an input you can change the default number later to customize the function.
(4) Click on the Verify button, a message will pop up saying that bars in average is not recognized as an existing function or input. Click the Add button then double click on the number in the Default Value field and change it to 7.
(5) Click on the Save button, type in Self Adjusting RSI k Oversold as the name for the function and then click the OK button.
FIGURE 7: TRADE NAVIGATOR/TRADE SENSE. Formula for the self-adjusting RSI k oversold indicator in Trade Navigator.
Self-adjusting RSI k overboughtYou can add your new RSI indicators to the chart by clicking on the chart, typing "A," selecting the Indicators tab, holding the Ctrl key on your keyboard down and selecting the indicators from the list then clicking the Add button. You may then move the indicator to the desired pane by clicking and dragging the indicator's label into that pane.
(1) Go to the Edit menu and click on Functions. This will bring up the Trader's Toolbox already set to the Functions tab.
(2) Click on the New button.
(3) Type the formula (Std Devs As Value (RSI (Close , bars in average , False) , bars in average , 1.8)) into the Function window. By setting bars in average as an input you can change the default number later to customize the function.
(4) Click on the Verify button, a message will pop up saying that bars in average is not recognized as an existing function or input. Click the Add button then double click on the number in the Default Value field and change it to 7.
(5) Click on the Save button, type in Self Adjusting RSI k Overbought as the name for the function and then click the OK button.Self Adjusting RSI c Oversold
(1) Go to the Edit menu and click on Functions. This will bring up the Trader's Toolbox already set to the Functions tab.
(2) Click on the New button.
(3) Type the formula 50 - 2 * MovingAvg (Abs (RSI (Close , bars in average , False) - MovingAvg (RSI (Close , bars in average , False) , bars in average)) , bars in average) into the Function window. By setting bars in average as an input you can change the default number later to customize the function.
(4) Click on the Verify button, a message will pop up saying that bars in average is not recognized as an existing function or input. Click the Add button then double-click on the number in the Default Value field and change it to 7.
(5) Click on the Save button, type in Self Adjusting RSI c Oversold as the name for the function and then click the Ok button.Self Adjusting RSI c Overbought
(1) Go to the Edit menu and click on Functions. This will bring up the Trader's Toolbox already set to the Functions tab.
(2) Click on the New button.
(3) Type the formula 50 + 2 * MovingAvg (Abs (RSI (Close , bars in average , False) - MovingAvg (RSI (Close , bars in average , False) , bars in average)) , bars in average) into the Function window. By setting bars in average as an input you can change the default number later to customize the function.
(4) Click on the Verify button, a message will pop up saying that bars in average is not recognized as an existing function or input. Click the Add button then double click on the number in the Default Value field and change it to 7.
(5) Click on the Save button, type in Self Adjusting RSI c Overbought as the name for the function and then click the OK button.
If you desire to change the number of bars to use for these indicators, simply click on the chart that you have added them to, type the letter E on your keyboard, select the indicator from the list click the Value field next to bars in average on the right side of the window and type the new number of bars to use in the average (Figure 8).
FIGURE 8: TRADE NAVIGATOR. Changing the bars in average field.
For your convenience, Genesis has created a special file that you
can download through Trade Navigator that will add these four indicators
to Trade Navigator for you. Simply download the free file "SCFEB06" using
your Trade Navigator program and follow the upgrade prompts.
--Michael HermanGO BACK
Genesis Financial Technologies
https://www.GenesisFT.com
TECHNIFILITER PLUS: SELF-ADJUSTING RSI
Here are the TechniFilter Plus formulas for the self-adjusted RSI, as described in David Sepiashvili's article in this issue, "The Self-Adjusting RSI." A sample chart is shown in Figure 9.
FIGURE 9: TECHNIFILTER PLUS, RSI. Here is the self-adjusted RSI in TechniFilter.
1. NAME: SelfAdjustingRSI_STD
SWITCHES: multiline
PARAMETERS: 1.8,14
FORMULA:
[1]: 50+ &1* CG&2|&2 {c}{nc} {Upper}{rgb#16711680}
[2]: 50- &1* CG&2|&2 {c}     {Lower}{rgb#16711680}
[3]: CG&2 {c}   {rgb#255}
[4]: 70 {c}  {rgb#0}
[5]: 30 {c}  {rgb#0}
[6]: 50 {c}  {rgb#8421504}
COMMENT: Standard deviation method
2. NAME: SelfAdjustingRSI_SAD
SWITCHES: multiline
PARAMETERS: 1.8,2,14
FORMULA:
[1]: 50+ &2*(CG&3-Cg&3A&3)U0A&3 {c}{nc} {Upper}{rgb#16711680}
[2]: 50- &2*(CG&3-Cg&3A&3)U0A&3 {c}     {Lower}{rgb#16711680}
[3]: CG&3 {c}   {rgb#255}
[4]: 70 {c}  {rgb#0}
[5]: 30 {c}  {rgb#0}
[6]: 50 {c}  {rgb#8421504}
COMMENT:  Smoothed absolute deviation method
Visit the TechniFilter Plus website to download these formulas.
--Benzie Pikoos, BrightsparkGO BACK
+61 8 9375-1178
sales@technifilter.com
www.technifilter.com
BIOCOMP DAKOTA: SELF-ADJUSTING RSI
David Sepiashvili's self-adjusting RSI is easily implemented in BioComp
Dakota, our new Swarm Technology walk-forward trading software. Dakota
users merely need to create three adaptable parameters: the RSI period
and the buy and sell thresholds, such as:
Then in the CreateSignal function, use the built-in RSI function and create a conditional evaluation against the thresholds, looking for the transition across them:ParameterName(1) = "RSI Period" ParameterMin(1) = 5 ParameterMax(1) = 20 ParameterName(2) = "Buy Threshold" ParameterMin(2) = 10 ParameterMax(2) = 40 ParameterName(3) = "Sell Threshold" ParameterMin(3) = 60 ParameterMax(3) = 90
Automatically, Dakota will create a swarm of RSI trader bots that adapt their periods and thresholds to flock toward current equity gains.RSI = Dakota.RSI(PriceHistory,ParameterValue(1)) if PriorRSI < ParameterValue(2) and RSI > ParameterValue(2) then Signal = -1 elseif PriorRSI > ParameterValue(3) and RSI < ParameterValue(3) then Signal = 1 else Signal = PriorSignal end if PriorSignal = Signal
Dakota users can download the full scriptbot script from the private Dakota site at https://www.biocompsystems.com/Dakota.
--Carl CookGO BACK
BioComp Systems, Inc.
www.biocompsystems.com/profit
952 746-5761
NEOTICKER: SELF-ADJUSTING RSI
In his article "The Self-Adjusting RSI," David Sepiashvili presents an indicator called the adjustable benchmark. This indicator can be implemented as a formula indicator in NeoTicker. The indicator has three parameters:
The indicator we named the "TASC adjusted benchmark 2" (Listing 1) will plot two lines on a chart that correspond to overbought and oversold lines.
Listing 1
$c := param3;
$n := param1;
$m := param2;
myRSI := rsindex(data1, $n);
plot1 := 50+$c*average(abs(myRSI-average(myRSI,$n)),$m);
plot2 := 50-$c*average(abs(myRSI-average(myRSI,$n)),$m);
When adding an adjusted benchmark to a chart, it will be plotted
in a different pane than the RSI. To put adjusted benchmarks into the RSI
pane, select the adjusted benchmarks indicator by clicking on the label
in the left-hand corner of the pane, hold down left mouse button, and drag
it into the pane where the RSI is plotted. The resulting chart will have
benchmarks and the RSI plotted in the same pane (Figure 10).
FIGURE 10: NEOTICKER, RSI. Here are the adjustable benchmarks in NeoTicker.
A downloadable version of this indicator and a sample chart
group will be available at NeoTicker's Yahoo! User Group website.
--Kenneth Yuen, TickQuest Inc.GO BACK
www.tickquest.com
TRADECISION: SELF-ADJUSTING RSI
After reading David Sepiashvili's article, "The Self-Adjusting RSI," we gained a new perspective on using RSI and its levels. Based on Sepiashvili's ideas, it's easy to create a trading strategy in Tradecision to generate buy/sell signals based on the RSI with self-adjusted overbought-oversold benchmarks.
First, in the Function Builder, we need to write a new function that returns a "1" in the case where RSI is above the overbought benchmark; "-1" if RSI is under the oversold benchmark; and zero in all other cases.
When we use the standard deviation method, we'll name the new function
RSISelfAdjusted:
function (price:numeric,length:Numeric):Numeric;
var
   rsiVal:= RSI(price,length);
   stdVal:=StdDev(rsiVal,length);
   scaledVal := 1.8 * stdVal;
end_var
if (rsiVal > 50 + scaledVal ) then return 1;
if (rsiVal < 50- scaledVal ) then return -1;
return 0;
When we use the smoothed absolute deviation method, we'll name it
RSISelfAdjusted2:
function (price:numeric,length:Numeric):Numeric;
var
   rsiVal:= RSI(price,length);
   absVal:= abs( rsiVal - sma(rsiVal,length) );
   scaledVal := 2.0 * sma(absVal, length);
end_var
if (rsiVal > 50 + scaledVal ) then return 1;
if (rsiVal < 50- scaledVal ) then return -1;
return 0;
Next, create a new strategy in the Strategy Builder. Keep in mind
that the above functions return 1 or -1 in the case of overriding benchmarks.
(For this example, we will use the RSISelfAdjusted function, but you can
also create a strategy using the smoothed absolute deviation function.)
Now we can apply the strategy to a Nasdaq composite (^Ixic) daily chart (Figure 11).Entry Long return CrossAbove(RSISelfAdjusted(C,10), -1); Entry Short return CrossBelow(RSISelfAdjusted(C,10), 1);
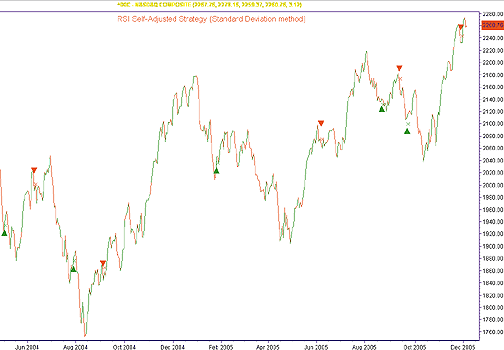
FIGURE 11: TRADECISION, SELF-ADJUSTED RSI (STANDARD DEVIATION METHOD). Here is the self-adjusted RSI trading strategy applied to a NASDAQ composite daily chart.
With the help of the Indicator Builder, we can also create the RSISelfAdjusted
indicator and insert it as a new subchart (Figure 12) to visually compare
strategy signals with it.
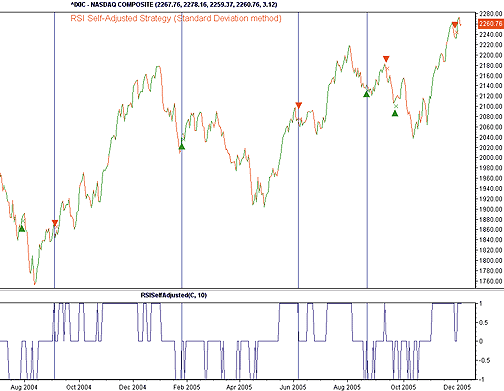
FIGURE 12: TRADECISION, SELF-ADJUSTED RSI (STANDARD DEVIATION METHOD). Here is the RSISelfAdjusted indicator inserted as a subchart so the user can visually compare strategy signals.
These trading techniques are available in the Tradecision KnowledgeBase at https://www.tradecision.com/knowledgebase.htm.in price:"Price",C; length:"Length",14; end_in return RSISelfAdjusted(price,length);
--Alex Grechanowski, Alyuda Research, Inc.
347 416-6083, alex@alyuda.com
www.alyuda.com, www.tradecision.com