Access to foreign exchange trading has opened up exciting trading options for the retail trader. You can now trade alongside corporations and institutions in a highly liquid market that is global, traded around the clock, and highly leveraged. Before jumping into this market, however, we must understand the factors that affect the forex market. With that in mind, STOCKS& COMMODITIES has introduced Forex Focus to better prepare the retail trader to participate in the currency market.
The Currency Combo
by Matt Blackman
Integrating strategies can increase forex trade confidence.
Before entering a trade, traders must do whatever they can to put the odds in their favor. Candlesticks have been helping traders in this for hundreds of years. From analyzing an individual candlestick right up to complex patterns involving a group of them, traders may gain a substantial advantage by learning to use them. Because they do an excellent job in giving visual cues to what is happening in the market, a candlestick chart can quickly show whether there is a trade coming, one setting up, or if nothing much is happening. Since there are excellent books already written on the topic, this article will instead focus on how to combine candlesticks with a crossover strategy on the US Dollar Index to provide more reliable buy and sell signals.
No matter what time frame you are using - from one minute to monthly - there are advantages to performing a candle-by-candle analysis. Why? The shape of the candle - where it opens or closes, its relation to the previous candle or candles, its position in the overall trend, and if its at or near levels of support or resistance - can provide insight about where price is going. By knowing what the highest-probability outcome is for the next candle, a trader can make a more rapid decision as to whether he or she should stay in, stay out, take a profit, or take a loss.
A CASE STUDY IN CANDLE PSYCHOLOGY
Being able to identify patterns is as important as knowing what an individual candlestick may be trying to tell us. When we look at the final couple of weeks of October 2005 in the US Dollar Index on the left-hand side of Figure 1, we see three separate attempts in five days to break above resistance at 90.20, only to have sellers knock prices back down. On the 20th and 21st days of the month, two more attempts were made and both were failures (point 3).
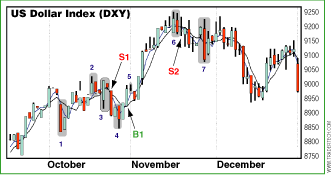
FIGURE 1: DAILY CHART SHOWING THE COMBINATION CANDLESTICK, AND MOVING AVERAGE CROSSOVER SIGNAL STRATEGIES. Point 1 shows the three-day moving average crossing over the five-day moving average together with a bullish harami candlestick pattern. The trader is warned that the move may be coming to an end by an engulfing bear candlestick pattern (point 2). This is followed by bearish harami, and then the three-day MA again crosses below the five-day MA, generating a sell signal (S1). The bearish engulfing pattern at point 4 is immediately followed by a bullish engulfing candlestick pattern, after which the moving average upward crossover confirms a buy signal (B1). At point 6, a bearish engulfing candlestick pattern (as well as a tweezer top) warns that the move may be nearing an end, and this is confirmed the next day by the moving average crossover generating a sell signal (S2). Point 7 shows a bullish harami followed by another potential crossover buy signal.
Return to March 2006 Contents
Originally published in the March 2006 issue of Technical Analysis
of STOCKS & COMMODITIES magazine. All rights reserved.
© Copyright 2006, Technical Analysis, Inc.