Improve Your Charting With P&F
Point & Figure & Forex
by Cornelius Luca
Why are point & figure charts well suited for the 24-hour trading arena in foreign exchange?
Typically, the majority of currency traders keep their eyes glued on bar and candlestick activity, but point & figure (P&F) charts can help them secure a profit. Line, bar, and candlestick charts need both prices and time periods for plotting. That's not the case for the P&F charts, because you need only prices. For the purposes of this chart, time is irrelevant. P&F charts' forte comes from the fact that they hide minor price fluctuations in order to filter out statistical noise and produce cleaner breakout points. The P&F charts are based on tick charts, so they are particularly well suited for the 24-hour trading in forex because there are no pauses between trading sessions.
ORIGINS
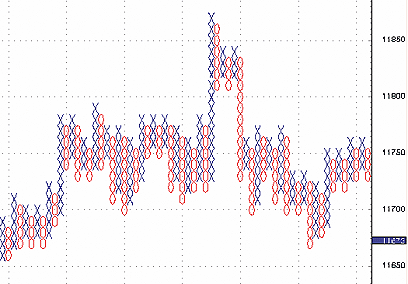
The P&F chart was originally referred to as the "book method" when it was developed at the end of the 19th century. Traders entered prices in their original numerical format rather than plotting a line or a bar. A hundred years ago, an analyst would have entered the full prices, but by the start of the 20th century, the numbers had been replaced with symbols: Xs for upward moves and Os for downward moves (Figure 1).

FIGURE 1: A TYPICAL P&F CHART. Here you see an example of a point & figure chart in euro/yen.
PRICE STRUCTURE
Two currency prices are divided in equal portions, which you will include in the boxes, rising or declining. Start with 10 pips in euro/dollar or sterling/dollar and probably five pips for euro/sterling, but optimize the size of these boxes based on currency and volatility. If you expect high volatility, then increase the size of the box, but if you are a daytrader who needs more sensitivity, then you can decrease the size of the box.
The most popular combination is called "one by three" (1x3), or one box by three boxes. The first number shows continuation of the ongoing direction, whether up or down, and the second tells you the number of boxes needed to reverse the previous move. By waiting for three boxes before turning ship, you can avoid short-term choppy markets. Every time your currency advances in an already established up move by a full 10-pip clip, you mark another X. To switch from an upward move to a downward one, the currency must fall by 30 pips, or three boxes, and then you write three Os. Conversely, you mark an O every time the currency is extending its ongoing decline by 10 pips, or one box. To reverse to the upside, the currency must rally by a minimum of 30 pips, or three boxes, and only then do you mark three Xs.
Let's take an example of a 1x3 P&F chart. Assuming that the established
direction is up (X columns) and the price range is 118.40 to 118.80, when
the price advances another 10 pips, such as from 118.80 to 118.90, you
mark it an additional X. You will disregard any price activity between
118.99 (not 10 pips up from 118.90) and 118.61 (not 30 pips down from 118.90).
The direction turns down into an Os column only when the price falls 30
pips from 118.90 to 118.60. Then you write three consecutive Os and the
main direction is now down.
...Continued in the April issue of Technical Analysis of STOCKS & COMMODITIES
Excerpted from an article originally published in the April 2006 issue of Technical Analysis of STOCKS & COMMODITIES magazine. All rights reserved. © Copyright 2006, Technical Analysis, Inc.
Return to April 2006 Contents