A Basis For Comparison
Cross-Market Evaluations With Normalized Average True Range
by John Forman
This technique can be useful to longer-term traders for comparing tradables.
Like Bollinger Bands, the average true range (ATR) indicator falls into the category of volatility-based technical analysis tools. It is grouped in such a way because rather than measuring the directional bias of a price move, it evaluates the amplitude of the price movement over a given time frame. Such information can be useful in evaluating markets.
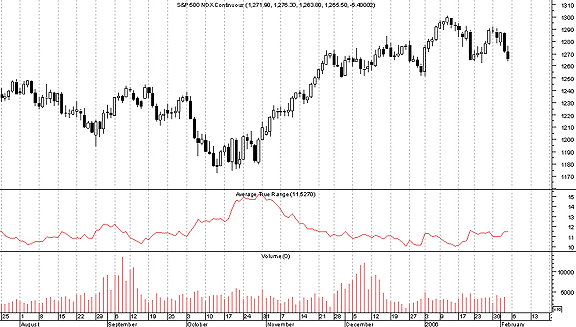
J. Welles Wilder, the originator of ATR, reported that he found high ATR values often occurring at market bottoms following a "panic" selloff. You can see this in the daily chart of the Standard & Poor's 500 futures (continuous contract) in Figure 1. As you can see, ATR rose during the market's selloff over the September-October time period and throughout the choppy bottom phase that followed.

FIGURE 1: THE STANDARD AVERAGE TRUE RANGE. Here you see the standard average true range (ATR) applied to the S&P 500 continuous contracts.
Low ATR values, according to Wilder, are often found during extended sideways periods, such as those found at tops and after consolidation periods. That can also be seen during the December consolidation after the November rally. In addition, ATR can also be low (or at least falling) while a market trends if it does so in a steady but unspectacular fashion.
The basic ATR reading has a potentially significant limitation, however: the ATR calculation makes things difficult for those who do comparative analysis.
ATR CALCULATION
The ATR calculation starts with determining the true range (TR). The TR for a given period is defined as being the largest of:
- Current period high - current period low
- Current period high - previous period close
- Previous period close - current period low
Let me make this clear: as calculated, ATR is not in any way normalized. Because it is purely a price measure, ATR cannot easily be used to compare different securities, as the indicator's readings would be expected to differ for tradables with different prices. For example, you would expect ATR to be significantly higher for a stock trading at $100 than for one trading at $20.
...Continued in the May issue of Technical Analysis of STOCKS & COMMODITIES
Excerpted from an article originally published in the May 2006 issue of Technical Analysis of STOCKS & COMMODITIES magazine. All rights reserved. © Copyright 2006, Technical Analysis, Inc.
Return to May 2006 Contents