Want More Accurate Price Estimates?
Bear Flags
by Markos Katsanos
Here's how you can estimate price targets more accurately in a declining price trend and more.
MY 2005 articles on flags included statistics for bullish flags only. Although my research started long before, the publication of the first article coincided with the worst market correction since 2003, and I have since received a number of emails from readers questioning the validity of the profit target formula as far as bearish formations are concerned.
This motivated me to research flags and pennants in a declining price trend. Results of the statistical analysis, together with a new formula for estimating a price target for the optimum exit strategy, will be derived later in this article.
My research includes observations on 100 bear flag, pennant, or similar short-term consolidation patterns for the preceding year and a half from January 2004 up to June 2005. The criterion I used for including a pattern on the list was a steep and quick price decline leading to the formation. My observations included:
- The price level and date of the lowest and highest point on the pole
- The last point on the flag before prices broke down below the lowest trendline of the formation, and
- The lowest price down to the first post-flag short-term bottom.
Statistical analysis revealed surprising findings, contradicting some widely accepted principles. Next, I'll discuss formation characteristics such as volume and pattern length, and I will derive a more realistic measuring formula.
FORMATION CHARACTERISTICS
Flags and pennants are quite common and useful for short-term trading, as the average formation length (not including the flagpole duration) is only eight trading days with a maximum of no more than 15 trading days or three calendar weeks.
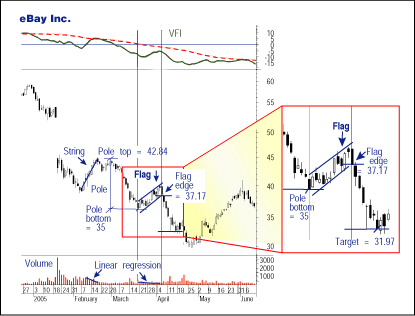
Bearish flags are characterized by higher tops and higher bottoms bounded by two parallel trendlines, with the pattern slanting up and against the prevailing trend (Figure 1). Pennants look similar to short-term symmetrical triangles, with tops and bottoms bounded by two converging trendlines (Figure 2).

FIGURE 1: FLAG FORMATIONS, eBAY. It is not uncommon for bear flags to appear in pairs. In this chart, the bear flag in late March 2005 was preceded by a string. Note the precipitous decline of the money flow (VFI) in the top window and also the volume decline during both formations in the bottom window depicted by the volume linear regression line (in blue). All target and pole numbers refer to the flag and not the string.
...Continued in the May issue of Technical Analysis of STOCKS & COMMODITIES
Excerpted from an article originally published in the May 2006 issue of Technical Analysis of STOCKS & COMMODITIES magazine. All rights reserved. © Copyright 2006, Technical Analysis, Inc.
Return to May 2006 Contents