So Many Options, So Little Time
Does Consecutive Covered Call Writing Beat Buy & Hold?
by Gunter Meissner and Sandra Wu
One of the most popular option strategies meets one of the most popular investing methods -- which will win?
One of the most popular option strategies is covered call writing. In this strategy, the investor owns the underlying asset, say a stock, and sells a call option on the asset. The investor believes the stock will move sideways during the option period. In this case, the call premium is earned as additional income. In this article we test whether a consecutive covered call writing strategy outperforms the buy & hold strategy.
THE COVERED CALL WRITING STRATEGY
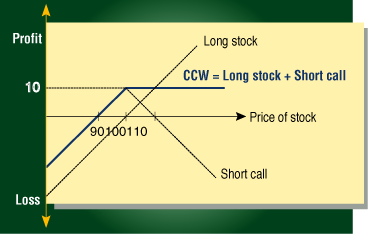
The covered call writing strategy (CCW) consists of two positions: Holding the underlying asset and selling a call on the underlying. Graphically, this can be expressed as in Figure 1, where the underlying asset is a stock.

FIGURE 1: EXAMPLE OF A COVERED CALL WRITING STRATEGY (CCW). The covered call writing strategy outperforms holding the stock if the price stays below the strike price plus the call premium, which in this case is 110.
The covered call writing strategy outperforms holding the stock if the stock price stays below the strike price plus the call premium, which in this case is 100 + 10 = 110. (For ease of explanation, in Figure 1 we ignored the interest rate effect of receiving the call premium at option start and paying a potential payoff later at option maturity.) However, a drawback of the CCW strategy is that it misses out on strong price gains. If the stock price is above 110, the CCW strategy is inferior to just holding the stock. In this case, the underlying is called away at the strike price of 100 and the received call premium of 10 cannot compensate for the strong increase in the stock price above 110. Another drawback of the CCW strategy is that losses occur if the underlying asset drops sharply, since you own the underlying.
THE METHOD AND DATA
In our study, we examined one-month and two-month calls on the Standard & Poor's 500 (SPX). We observed 35 years of data, from January 1970 to December 2004. As rollover dates for the call options, we chose the maturity date of the calls on the S&P 500, which is every third Friday of the month. We derived the historical implied volatility from the volatility index (VIX), which represents data of option prices of the S&P 500. We input the VIX implied volatility into a Black-Scholes model to derive the call option prices (a model can be found at www.dersoft.com/Black76.xls). The dividend yield for the S&P 500 was generated from Bloomberg.
...Continued in the May issue of Technical Analysis of STOCKS & COMMODITIES
Excerpted from an article originally published in the May 2006 issue of Technical Analysis of STOCKS & COMMODITIES magazine. All rights reserved. © Copyright 2006, Technical Analysis, Inc.
Return to May 2006 Contents