Access to foreign exchange trading has opened up exciting trading options for the retail trader. You can now trade alongside corporations and institutions in a highly liquid market that is global, traded around the clock, and highly leveraged. Before jumping into this market, however, we must understand the factors that affect the forex market. With that in mind, STOCKS& COMMODITIES has introduced Forex Focus to better prepare the retail trader to participate in the currency market.
Bearish P&F Formations
by Cornelius Luca
Previously, we looked at how point & figure charts could be applied in a bullish currency market. This time, we will look at how the technique can be applied in a bearish one.
Breakouts of lows, descending formations, and downward breakouts of support levels are all examples of what you can find in a bearish market. Now, let's take a look at how we can identify these formations using point & figure charts.
BREAKOUT OF A TRIPLE LOW
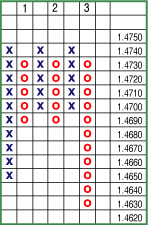
The breakout of a triple low is formed by two consecutive declines, which stop at the same support level, followed by a third one, which manages to break below this line. Figure 1 shows the price structure of a breakout of a triple low. In this diagram, the sterling/dollar consolidated in the range of 1.4690 to 1.4740, or six boxes. The first two selloffs failed at 1.4690. This support gave way during the third attack and the currency extended the selloff.

FIGURE 1: BREAKOUT OF A TRIPLE LOW PATTERN. Note that the sterling/dollar consolidated between 1.469 and 1.474. It wasn't until the third attack of support that prices broke out and the selloff extended.
BREAKOUT OF A SPREAD TRIPLE LOW
The spread triple low formation is a derivative of the breakout of a triple-low pattern. A currency fails to fall below the support at 1.2070 during the third consecutive selloff. However, after a brief recovery, it turns bearish again and breaks below this level, triggering a further bout of weakness. The diagram in Figure 2 illustrates this formation. Figure 3 shows a market example in euro/sterling.
Originally published in the May 2006 issue of Technical Analysis
of STOCKS & COMMODITIES magazine. All rights reserved.
© Copyright 2006, Technical Analysis, Inc.