May 2006
TRADERS' TIPS
You can copy these formulas and programs for easy use in your spreadsheet or analysis software. Simply "select" the desired text by highlighting as you would in any word processing program, then use your standard key command for copy or choose "copy" from the browser menu. The copied text can then be "pasted" into any open spreadsheet or other software by selecting an insertion point and executing a paste command. By toggling back and forth between an application window and the open Web page, data can be transferred with ease.
This month's tips include formulas and programs for:
TRADESTATION: Normalized Average True Range
WEALTH-LAB: Normalized Average True Range
AMIBROKER: Normalized Average True Range (N-ATR)
eSIGNAL: Normalized Average True Range (N-ATR)
NEUROSHELL TRADER: Normalized Average True Range (N-ATR)
AIQ: Normalized Average True Range (N-ATR)
NEOTICKER: Normalized Average True Range (N-ATR)
TRADING SOLUTIONS: Normalized Average True Range
BIOCOMP DAKOTA: Normalized Average True Range
ASPEN GRAPHICS: Normalized Average True Range
TRADECISION: Normalized Average True Range
VT TRADER: Normalized Average True Range
TRADE NAVIGATOR/TRADESENSE: Normalized Average True Range (N-ATR)
SMARTRADER: Normalized Average True Range
or return to May 2006 Contents
TRADESTATION: Normalized Average True Range
In his article, "Cross-Market Evaluations With Normalized Average True Range," John Forman uses a normalized average true range indicator to analyze tradables across markets.
Forman's normalized average true range technique can be coded with the
following EasyLanguage formula:
AvgTrueRange( 14 ) / Close * 100
This can be entered in the formula field of the built-in indicator
Custom 1 Line. Alternatively, custom code can be written for these studies,
such as the following:
Indicator:  N-ATR Line
inputs:
 Length( 14 ),
  Threshold( 6.15 ) ;
variables:
 NATR( 0 ) ;
NATR = AvgTrueRange( Length ) / Close * 100 ;
Plot1( NATR, "N-ATR" ) ;
Plot2( Threshold , "Threshold", Yellow ) ;
Indicator:  N-ATR Dots
inputs:
 Length( 14 ),
 Threshold( 6 ) ;
variables:
 NATR( 0 ) ;
NATR = AvgTrueRange( Length ) / Close * 100 ;
if NATR > Threshold then
 Plot1( Close , "N-ATR" ) ;
To download the TradeStation code for this article, search for the file "N-ATR.Eld" in the TradeStation Support Center at TradeStation.com. A sample chart is shown in Figure 1.

FIGURE 1: TRADESTATION AND RADARSCREEN, NORMALIZED AVERAGE TRUE RANGE (N-ATR). RadarScreen displays the S&P 100 components sorted with the highest normalized average true range (N-ATR) at the top. The chart is linked to RadarScreen and displays the stock with the highest N-ATR value: GM. The indicator displays values of the (N-ATR) and threshold. The threshold of 12 is used to display some of the higher N-ATR points on the daily price bars over the last 10 years.
GO BACK
--Mark Mills
TradeStation Securities, Inc.
www.TradeStationWorld.com
WEALTH-LAB: Normalized Average True Range
Wealth-Lab's arsenal of native indicators already includes a normalized ATR, called the ATR percent indicator, or ATRP. We put together a ChartScript that calculates the ATRP of a primary and secondary currency pair. The trading system compares the ATRP of both issues and enters a position with the one having the highest ATRP according to the following logic: We wait for three consecutive down closes, and then issue a BuyAtStop order for the PriceHigh of the current bar plus one Pip. We employed a chandelier trading stop as the sole sell logic to attempt to catch a ride on a short-term trend in the opposite direction.
In a raw-profit simulation using three pips of limit order slippage, and trading only the EUR/JPY contract from 1/2/2000 to 3/10/2006, the system returned $1,618 with 18 of 41 winners (43.9%). Likewise, when trading only theGBP/JPY contract over the same period, the system earned only $284 with 18 winners in 47 trades. However, after switching modes to dynamically trade the contract with the highest ATRP, the system's net profit doubled to $3,314 with 20 of 38 winners (52.6%). See Figure 2.

FIGURE 2: WEALTH-LAB, Normalized Average True Range (N-ATR). The simple entry logic and the chandelier exit proved to be an effective combination -- especially when trading currency pairs with the highest ATRP.
GO BACKWealthScript code: {$I 'ChandelierStop'} const TESTPRIMARYONLY = false; const SYM2 = 'GBPJPY A0-FX'; const PERIOD = 3; var Bar, p, hATRP, hATRP2, ATRPane: integer; var PIP: float = GetTick; ATRPane := CreatePane( 75, true, true ); hATRP := ATRPSeries( PERIOD ); { Calculate ATRP for the secondary symbol } SetPrimarySeries( SYM2 ); hATRP2 := ATRPSeries( PERIOD ); RestorePrimarySeries; PlotSeriesLabel( hATRP, ATRPane, #Gray, #Thick, 'ATRP: ' + GetSymbol ); PlotSeriesLabel( hATRP2, ATRPane, #Blue, #Histogram, 'ATRP: ' + SYM2 ); HideVolume; for Bar := 3 * PERIOD to BarCount - 1 do begin if LastPositionActive then begin p := LastPosition; SellAtTrailingStop( Bar + 1, ChandelierStop( Bar, p, 3, 2 ), p, 'Chandelier' ) end else begin if not TESTPRIMARYONLY then { Trade the symbol with the highest ATRP } if @hATRP[Bar] > @hATRP2[Bar] then RestorePrimarySeries else SetPrimarySeries( SYM2 ); if CumDown( Bar, #Close, 1 ) >= 3 then BuyAtStop( Bar + 1, PriceHigh( Bar ) + PIP, '' ); end; end;-Robert Sucher
www.wealth-lab.com
AMIBROKER: Normalized Average True Range (N-ATR)
In "Cross-Market Evaluations With Normalized Average True Range," John
Forman shows how to interpret the classic ATR indicator as well as its
normalized version (N-ATR). ATR is a built-in function of AmiBroker Formula
Language, and implementing the normalized ATR is very easy. Ready-to-use
code is provided in Listing 1. For your convenience, we have added some
parameters that allow you to adjust the ATR period from the user interface.
LISTING 1
Periods = Param("Periods", 14, 2, 100 );
Plot( 100 * ATR( Periods ) / Close, "NATR"+Periods, colorRed );
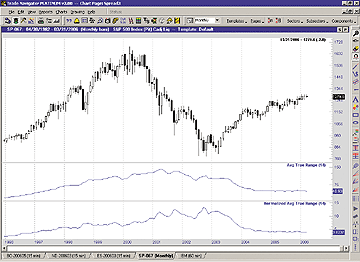
Figure 3 shows monthly price chart of the Standard & Poor's 500 (upper
pane) with a 14-bar normalized ATR.

FIGURE 3: AMIBROKER, NORMALIZED AVERAGE TRUE RANGE (N-ATR). Here is a sample AmiBroker chart demonstrating a 14-bar normalized ATR (lower pane) on a monthly price chart of the S&P 500 (upper pane).
-Tomasz Janeczko, AmiBroker.comGO BACK
www.amibroker.com
eSIGNAL: Normalized Average True Range (N-ATR)
For John Forman's article, "Cross-Market Evaluations With Normalized Average True Range," we've provided the formula "Normalized_ATR.efs." This study plots the N-ATR indicator as a nonprice study. Through the Edit Studies option in the Advanced Chart, there is one study parameter that may be customized, which is the number of periods for the N-ATR.
To discuss this study or download a complete copy of the formula, please visit the EFS Library Discussion Board forum under the Bulletin Boards link at www.esignalcentral.com. The eSignal formula script (EFS) is also available for copying and pasting from the STOCKS & COMMODITIES website at www.Traders.com. A sample chart is shown in Figure 4.

FIGURE 4: eSIGNAL, NORMALIZED AVERAGE TRUE RANGE. Here is a demonstration of the normalized average true range in eSignal.
/***************************************
Provided By : eSignal (c) Copyright 2006
Description:  Cross-Market Evaluations With Normalized
              Average True Range - by John Forman
Version 1.0  03/03/2006
Notes:
* May 2006 Issue of Stocks & Commodities Magazine
* Study requires version 7.9.1 or higher.
Formula Parameters:      Defaults:
Periods                             14
***************************************/
function preMain() {
    setStudyTitle("Normalized ATR");
    setCursorLabelName("N-ATR", 0);
    setDefaultBarThickness(2, 0);

    var fp1 = new FunctionParameter("nPeriods", FunctionParameter.NUMBER);
        fp1.setName("N-ATR Periods");
        fp1.setLowerLimit(1);
        fp1.setDefault(14);
}
var bVersion = null;
function main(nPeriods) {
    if (bVersion == null) bVersion = verify();
    if (bVersion == false) return;
    if (getCurrentBarCount() <= nPeriods) return null;

    return (atr(nPeriods, 0)/close(0))*100;
}
function verify() {
    var b = false;
    if (getBuildNumber() < 730) {
        drawTextAbsolute(5, 35, "This study requires version 7.9.1 or later.",
            Color.white, Color.blue, Text.RELATIVETOBOTTOM|Text.RELATIVETOLEFT|Text.BOLD|Text.LEFT,
            null, 13, "error");
        drawTextAbsolute(5, 20, "Click HERE to upgrade.@URL=https://www.esignal.com/download/default.asp",
            Color.white, Color.blue, Text.RELATIVETOBOTTOM|Text.RELATIVETOLEFT|Text.BOLD|Text.LEFT,
            null, 13, "upgrade");
        return b;
    } else {
        b = true;
    }

    return b;
}
--Jason Keck
eSignal, a division of Interactive Data Corp.
800 815-8256, www.esignalcentral.com
NEUROSHELL TRADER: Normalized Average True Range (N-ATR)
The normalized average true range indicator described by John Forman in his article in this issue can be easily implemented in NeuroShell Trader by combining a few of NeuroShell Trader's 800+ indicators. To implement the indicator, select "New Indicator ..." from the Insert menu and use the Indicator Wizard to create the following indicator:
Multiply( Divide( AvgTrueRange( High, Low, Close, 14), Close), 100)
A sample chart is shown in Figure 5. For more information on NeuroShell Trader, visit www.NeuroShell.com.

FIGURE 5: NEUROSHELL, NORMALIZED AVERAGE TRUE RANGE. Here is a sample NeuroShell chart demonstrating a comparison of the average true range to the normalized average true range.GO BACK
--Marge Sherald, Ward Systems Group, Inc.
301 662-7950, sales@wardsystems.com
www.neuroshell.com
AIQ: Normalized Average True Range (N-ATR)
The AIQ code for John Forman's normalized average true range is given here. The normalized average true range (N-ATR) is a useful function for comparing volatility of stocks to each other and to the market in general. It can be an effective filter for a stock-trading system to improve the quality of the trading signals.
To test this idea, I created a volatility range filter that is adaptive to the market's volatility using the N-ATR indicator. Using stocks from both the NASDAQ 100 and the S&P 500 as a test list, I then used the following simple dip-buying strategy:
Enter a long position if:
1) The five-day RSI is below the oversold benchmark, andExit all long positions after five trading days.
2) The stock is trading above its 50-day simple moving average.
To select between signals when there are more than can be taken on a single day, I used the 30-day relative strength based on the AIQ formula and chose the strongest in descending order.
To test the effectiveness of the N-ATR filter, I ran two tests using
the AIQ Portfolio Simulator using the combined list over the last three
years. I did not attempt to optimize the results. One test was run without
the filter and the other was run with the filter. The addition of the volatility
filter made a significant improvement as shown in Figure 6, which compares
the resulting equity curves of the two tests.

FIGURE 6: AIQ, NORMALIZED AVERAGE TRUE RANGE. Here is a comparison of equity curves with and without the N-ATR filter.
The AIQ code for the N-ATR indicator can be downloaded from AIQ's
website at www.aiqsystems.com and also can be viewed at www.Traders.com.
-Richard Denning, AIQ SystemsGO BACK
richard.denning@earthlink.net
NEOTICKER: Normalized Average True Range (N-ATR)
The concept presented in "Cross-Market Evaluations With Normalized Average True Range" by John Forman can be implemented in NeoTicker using formula language.
To build the charts in the article, open a new chart and add the S&P
500 daily data series. Add to the chart the build-in indicator for the
14-period average true range. Next, add a formula indicator to the data
series and enter the formula for the normalized average true range:
avgtruerange(data1, 14)/c*100
This results in a chart that shows the ATR in one pane and the N-ATR
in another (Figure 7A).
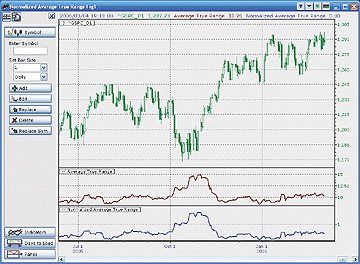
FIGURE 7A: NEOTICKER, NORMALIZED AVERAGE TRUE RANGE. Here is a daily chart of the S&P 500 index showing the ATR in one pane and the N-ATR in another.From there, you can also plot these on a monthly chart by copying the chart window to a new window and changing the data type to monthly. To do this, right-click on the daily chart window and select "Copy to New Window" at the popup menu. All settings and indicators are retained in the new window.
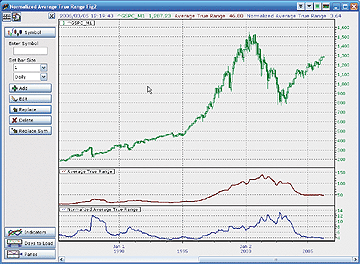
FIGURE 7B: NEOTICKER, NORMALIZED AVERAGE TRUE RANGE. Here is a monthly chart of the S&P 500 index showing the ATR in one pane and the N-ATR in another.
A downloadable version of this chart group will be available from
the NeoTicker blog site (https://blog.neoticker.com).
GO BACK
-- Kenneth Yuen, TickQuest Inc.
www.tickquest.com
TRADING SOLUTIONS: Normalized Average True Range
In "Cross-Market Evaluations With Normalized Average True Range," John Forman introduces a normalized version of the average true range. These functions can be entered into TradingSolutions as follows:
Function Name: Normalized ATR
Short Name: N-ATR
Inputs: Close, High, Low, Period
Div (ATR (Close, High, Low, Period), Close)
These functions are also available as a function file that can be
downloaded from the TradingSolutions website (www.tradingsolutions.com)
in the Solution Library section. Normalizing indicators is a good way to
make them more informative as neural network inputs.
GO BACK
--Gary Geniesse, NeuroDimension, Inc.
800 634-3327, 352 377-5144
www.tradingsolutions.com
BIOCOMP DAKOTA: Normalized Average True Range
The normalized average true range indicator discussed by John Forman
in his article in this issue, "Cross-Market Evaluations With Normalized
Average True Range," can be easily implemented in BioComp Dakota by calling
the built-in true range and moving average functions. This can be done
in the ScriptBot CreateSignal function, as shown below, or in a ScriptStop.
TrueRangeHistory(PriceCtr) = Dakota.TrueRange(HighHistory, LowHistory, CloseHistory)
NATR = Dakota.SMA(TrueRangeHistory,14)/Prices(CLOSE)*100
Of course, the N-ATR could be made adaptable bar-by-bar by
merely changing the "14" in the moving average to "ParameterValue(1)."
A snip of a plot of the N-ATR is shown in Figure 8 for the last five years
of the S&P 500 futures continuous contract.

FIGURE 8: BIOCOMP, NORMALIZED AVERAGE TRUE RANGE. Here is a sample plot of the N-ATR for the last five years of the S&P 500 futures continuous contract.
GO BACK
--Carl Cook
BioComp Systems, Inc.
www.biocompsystems.com/profit
952 746-5761
ASPEN GRAPHICS: Normalized Average True Range
The average true range and normalized average true range formulas described
in John Forman's article are easy to replicate in Aspen Graphic's formula
writing language. The two formulas below can be copied and pasted into
the Aspen Graphics formula writer.
AvgTrueRange(series)= mavg($1.TRange,14)
Normalized_ATR(series)=(AvgTrueRange($1)/$1.close)*100
The formulas can then be applied to a chart as Formula Studies (Figure
9).

FIGURE 9: ASPEN GRAPHICS, NORMALIZED AVERAGE TRUE RANGE (N-ATR). Here are the ATR and N-ATR formulas applied to a chart as formula studies.
One way to compare multiple securities is to create one chart for
each instrument and then display them side by side (Figure 10a). Another
comparison method available in Aspen Graphics is to create a layered chart
and then display the study results for both symbols simultaneously (Figure
10B).
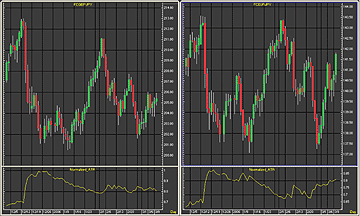
FIGURE 10A: ASPEN GRAPHICS, COMPARING INSTRUMENTS. One way to compare multiple securities is by charting them side by side in two panes.
FIGURE 10B: ASPEN GRAPHICS, COMPARING INSTRUMENTS. Another comparison method available in Aspen Graphics is to create a layered chart and then display the study results for both symbols simultaneously, as shown above.
For help with these formulas or any feature in Aspen Graphics, contact
a support technician at 970 945-2921 or support@aspenres.com.
--Ken Woods, Aspen Research Group, Ltd.GO BACK
970 945-2921, support@aspenres.com
www.aspenres.com
TRADECISION: Normalized Average True Range
In the article "Cross-Market Evaluations With Normalized Average True Range," John Forman describes N-ATR as a tool for improving one's trading and/or market analysis by making a historical and multiple-security comparison.
With the help of Indicator Builder, you can easily code the N-ATR indicator and insert it into a Tradecision chart (Figure 11).
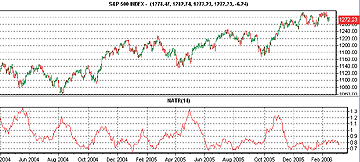
FIGURE 11: TRADECISION, NORMALIZED AVERAGE TRUE RANGE. Here is a sample daily chart of the S&P 500 index with the N-ATR indicator inserted.
The following is the code for the N-ATR indicator in Tradecision:
input
     length:"Length",14;
end_input
return AvgTrueRng(length)/C*100;
You can also recreate the N-ATR function in Function Builder for
using the analysis technique in any of the Tradecision modules. The following
is the code for the function:
function (length:Numeric):Numeric;
return AvgTrueRng(length)/C*100;
The N-ATR indicator and function can be downloaded from the Tradecision
KnowledgeBase at https://www.tradecision.com/knowledgebase.htm.
--Alex Grechanowski, Alyuda Research, Inc.GO BACK
alex@alyuda.com, 347 416-6083
www.alyuda.com, www.tradecision.com
VT TRADER: Normalized Average True Range
John Forman's article in this issue, "Cross-Market Evaluations With
Normalized Average True Range," discusses the benefits of normalizing indicators,
particularly the average true range (ATR) indicator, to allow for more
accurate comparisons between two or more trading instruments. We'll be
offering the N-ATR indicator for download in our user forums. The VT Trader
code and instructions for creating this indicator are as follows (each
input variable has been parameterized to allow customization):
1. Navigator Window>Tools>Indicator Builder>[New] button
2. In the Indicator Bookmark, type the following text for each field:
Name: Average True Range (ATR) - Normalized
Short Name: vt_ATRN
Label Mask: Average True Range - Normalized (%tp:ls%, %tPr%)
Placement: New Frame
Inspect Alias: Normalized ATR
3. In the Input Bookmark, create the following variables:
[New] button... Name: tPr , Display Name: Periods , Type: integer , Default: 14
[New] button... Name: stp , Display Name: Smoothing Type , Type: Enumeration ,
 Default: click [...] button, [New] button, then create the following entries: Wilders ,
 Custom ; then click [OK] button
Default: Wilders (chosen from list created)
4. In the Output Bookmark, create the following variables:
[New] button...
Var Name: N_ATR
Name: (Normalized ATR)
Line Color: dark green
Line Width: thin line
Line Type: solid line
5. In the Formula Bookmark, copy and paste the following formula:
{Provided By: Visual Trading Systems, LLC (c) Copyright 2006}
{Description: Normalized Average True Range (N-ATR) by John Forman}
{Notes: May 2006 Issue - Cross-Market Evaluations with Normalized Average True Range}
{N-ATR Version 1.0}
TH:= if(Ref(C,-1) > H,Ref(C,-1),H);
TL:= if(Ref(C,-1) < L,Ref(C,-1),L);
TR:= TH-TL;
N_ATR:= (if(stp=0, Wilders(TR,tPr), mov(TR,tPr,S)))*100/C;
6. Click the "Save" icon to finish building the N-ATR indicator.
To attach the N-ATR indicator to a chart, right-click within the
chart window and then select "Add Indicators" -> "Average True Range (ATR)
-- Normalized" from the indicator list (Figure 12). Users will have the
ability to customize the parameters at this time. Once attached to the
chart, right-clicking over the displayed indicator label and selecting
"properties" allows customization of the parameters.
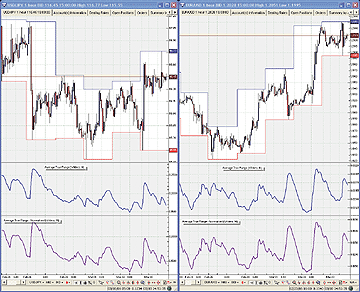
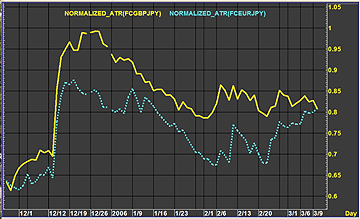
FIGURE 12: VT TRADER, NORMALIZED AVERAGE TRUE RANGE. This sample chart displays the EUR/USD 60-minute and USD/JPY 60-minute charts, each with the standard ATR and also the normalized ATR (N-ATR).To learn more about VT Trader, visit www.cmsfx.com.
-Chris Skidmore
Visual Trading Systems, LLC (courtesy of CMS Forex)
866 51-CMSFX, trading@cmsfx.com
TRADE NAVIGATOR/TRADESENSE: Normalized Average True Range (N-ATR)
In Trade Navigator Gold and Platinum versions, you can create custom functions to display on the chart as indicators. This allows you to add your own indicators to the list of indicators already provided in Trade Navigator. You can also add indicators that other people have written.
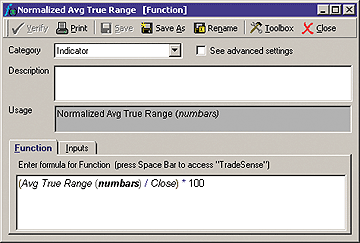
To add the normalized average true range indicator to the list of indicators in Trade Navigator, follow these steps:
1) Go to the Edit menu and click on Functions. This will bring up the Trader's Toolbox already set to the Functions tab.
2) Click "New."
3) Type the following formula:
into the Function window. By setting "numbars" as an input, you can change the default number later to customize the function.(Avg True Range (numbars) / Close) * 100
4) Click on the Verify button. A message will pop up saying that "numbars" is not recognized as an existing function or input. Click the Add button and change the number in the Default Value field to "14."
(5) Click on the Save button, type in "Normalized Avg True Range" as the name for the function, and then click the OK button.
You can add your new normalized average true range indicator to the chart (Figure 13) by clicking on the chart, typing "A," selecting the Indicators tab, selecting "Normalized Avg True Range" from the list, and clicking the Add button. You may then move the indicator to the desired pane by clicking and dragging the indicator's label into that pane.
For your convenience, Genesis has created a special file that you can download through Trade Navigator. This special file will add the normalized average true range indicator to Trade Navigator for you. Simply download the free special file "scmay06" from within Trade Navigator, and follow the upgrade prompts.FIGURE 13: TRADE NAVIGATOR, NORMALIZED AVERAGE TRUE RANGE. Here is the N-ATR plotted in Trade Navigator.
--Michael HermanGO BACK
Genesis Financial Technologies
www.GenesisFT.com
SMARTRADER: Normalized Average True Range
Recreating John Forman's normalized average true range (ATR) in SmarTrader is very simple. All that is required is three calculations: true range, average true range, and a formula to normalize average true range as a percent of closing price.
We start by adding the true range study, Tr_rang, in row 9. Then, add the ATR study in row 10, with periods set to 14. Finally, add a user formula in row 11, with the calculation as described in the article.
You can plot the ATR and N_ATR in separate chart windows, or for a more graphic comparison, first plot the ATR, then plot the N_ATR in the same window as an overlay.
The SmarTrader specsheet for this study is shown in Figure 14.
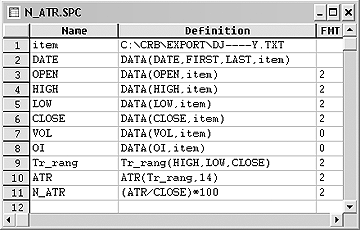
FIGURE 14: SMARTRADER, NORMALIZED AVERAGE TRUE RANGE. Here is the SmarTrader specsheet for implementing the N-ATR.
--Jim Ritter, Stratagem Software
800 779-7353 or 504 885-7353
info@stratagem1.com, www.stratagem1.com
