Relearning Techniques OFT Forgot
Trading The Trend In Wave 3
by Mircea Dologa, MD
Here's a refresher course on techniques you can use to trade wave 3, in part 2 of three.
When trading wave 3, any number of methods could be used, so many that it's easy to overlook one or two. So which one would be best? Here are a few that may pique your interest, including some that you may have long forgotten.
PITCHFORKS AND CHANNELS
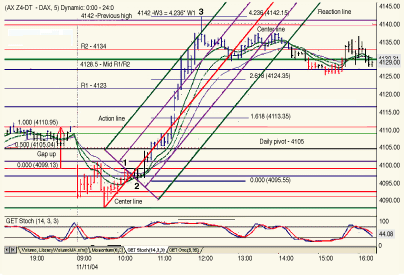
The pitchfork technique should be a standard tool to use when trying to measure the slope of the trend of wave 3. The slope is important because its characteristics play a part in defining the exit. In the pitchfork method, a technician will pick an extreme low or high to use as an anchor pivot point and draw a median line. Action and reaction lines are drawn through high and low points, defining the support and resistance levels for the price channel. In Figure 1, the exit at 4135 takes place where the market price crosses with the first upper parallel line above the center line.

Figure 1: Pitchforks and price channels. You can use pitchforks and channels to help determine your exits. In this example, the point where price crosses the first upper parallel line is where you should exit your trade.
The channeling technique is another helpful tool for wave analysis. In this method, a price channel contains prices through the course of a trend; historically, this term has been used to denote the area between the base trendline and the reaction trendline defined by price moves against the prevailing trend. Channeling's main function is to delineate the exhaustion zones, where the local market will certainly perform, either as a reversal, an acceleration, or a consolidation move. Thus, it serves as an optimal timing guide, giving the trader a prolific competitive edge. The channeling technique is used on primary and lesser-degree waves:
- w2-4 base trendline (very important)
- w1 parallel trendline
- w3 parallel trendline
- w1-3 -- 50% parallel trendline
- w1-3 nonparallel trendline
Even though these techniques can be used for multiple types of wave degrees, they are more important on lesser-degree wave levels.
...Continued in the June issue of Technical Analysis of STOCKS & COMMODITIES
Excerpted from an article originally published in the June 2006 issue of Technical Analysis of STOCKS & COMMODITIES magazine. All rights reserved. © Copyright 2006, Technical Analysis, Inc.
Return to June 2006 Contents