TRADERS' TIPS - August 2006
You can copy these formulas and programs for easy use in your spreadsheet or analysis software. Simply "select" the desired text by highlighting as you would in any word processing program, then use your standard key command for copy or choose "copy" from the browser menu. The copied text can then be "pasted" into any open spreadsheet or other software by selecting an insertion point and executing a paste command. By toggling back and forth between an application window and the open Web page, data can be transferred with ease.
Editor's note: This month's Traders' Tips are based on John Ehlers' article in this issue, "Modeling The Market = Building Trading Strategies." Code written in EasyLanguage for TradeStation is provided by the author in the article's sidebars. Additional code is presented here.
Readers will find our Traders' Tips section in its entirety at the STOCKS & COMMODITIES website at www.Traders.com in the Traders' Tips area, from where the code can be copied and pasted into the appropriate program. In addition, the code for each program is usually available at the respective software company's website. Thus, no retyping of code is required for Internet users.
For subscribers, code found in Ehlers' article can be copied and pasted into TradeStation from the Subscriber Area at www.Traders.com. Login is required.
This month's tips include formulas and programs for:
![]() TRADESTATION: MODELING THE MARKET
TRADESTATION: MODELING THE MARKET
![]() METASTOCK:
MODELING THE MARKET
METASTOCK:
MODELING THE MARKET
![]() eSIGNAL:
MODELING THE MARKET
eSIGNAL:
MODELING THE MARKET
![]() AIQ:
MODELING THE MARKET
AIQ:
MODELING THE MARKET
![]() WEALTH-LAB:
MODELING THE MARKET
WEALTH-LAB:
MODELING THE MARKET
![]() AMIBROKER:
MODELING THE MARKET
AMIBROKER:
MODELING THE MARKET
![]() NEUROSHELL
TRADER: MODELING THE MARKET
NEUROSHELL
TRADER: MODELING THE MARKET
![]() NEOTICKER:
MODELING THE MARKET
NEOTICKER:
MODELING THE MARKET
![]() MULTICHARTS:
MODELING THE MARKET
MULTICHARTS:
MODELING THE MARKET
![]() TRADING
SOLUTIONS: MODELING THE MARKET
TRADING
SOLUTIONS: MODELING THE MARKET
![]() BIOCOMP
DAKOTA: MODELING THE MARKET
BIOCOMP
DAKOTA: MODELING THE MARKET
![]() VT
TRADER: MODELING THE MARKET
VT
TRADER: MODELING THE MARKET
![]() TRADECISION:
MODELING THE MARKET
TRADECISION:
MODELING THE MARKET
Return to August 2006 Contents
TRADESTATION: MODELING THE MARKET
John Ehlers' article in this issue, "Modeling The Market = Building Trading Strategies," describes a process for extracting trend and cyclic elements from market data, then recombining them for trading purposes. The article includes code for three indicators. The author suggests that three strategies could follow from his model.
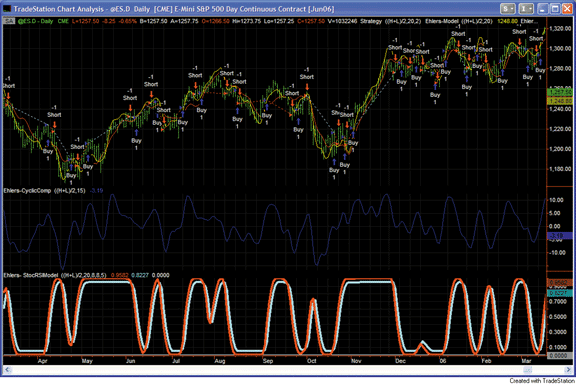
FIGURE 1: TRADESTATION, EHLERS INDICATORS. The top subgraph displays price data, Ehlers' model (yellow line) and the instantaneous trend (red line). The second subgraph displays the cyclic component indicator. The third subgraph displays the StochasticRSI transformation of Ehlers' model. The simulated trades shown in the sample chart above were generated in the EasyLanguage strategy by crosses of instantaneous trend and its two-bar delay line.
Custom EasyLanguage code for two of the three indicators is shown
here. All three strategies and related indicators, including the StochasticRSI
transform, can be found in the EasyLanguage Library at TradeStation.com
within the file "EhlersModel.eld."
Strategy:  Ehlers-InstTrend
inputs:
 Price( MedianPrice ),
 Length( 20 ),
 Delay( 2 ) ;
variables:
 SMA( 0 ),
 Mom( 0 ),
 SmoothMom( 0 ),
 ITrend( 0 ) ;
SMA = Average( Price, Length ) ;
Mom = Momentum( Price, Length - 1 ) ;
SmoothMom = ( Mom + 2 * Mom[1] + 2 * Mom[2] +
 Mom[3] ) / 6 ;
ITrend = SMA + 0.5 * SmoothMom ;
if ITrend crosses over ITrend[Delay] then
 Buy next bar market
else if ITrend crosses under ITrend[Delay] then
 Sell short next bar at market ;
Strategy:  Ehlers-StoRSIModel
inputs:
 Price( MedianPrice ),
 Length( 20 ),
 RSILen( 8 ),
 StochLen( 8 ),
 WAveLen( 5 ) ;
variables:
 SMA( 0 ),
 Mom( 0 ),
 SmoothMom( 0 ),
 ITrend( 0 ),
 DegPerBar( 0 ),
 CosineValue( 0 ),
 Alpha( 0 ),
 OneBarDiff( 0 ),
 HP( 0 ),
 SmoothHP( 0 ),
 Synth( 0 ),
 CU( 0 ),
 CD( 0 ),
 Count( 0 ),
 CntPlus1( 0 ),
 CUAve( 0 ),
 CDAve( 0 ),
 RSI0( 0 ),
 RSILenLess1( 0 ),
 HiR( 0 ),
 LoR( 0 ),
 StochR( 0 ),
 StochRSI( 0 ),
 StochRSIDiv( 0 ),
 Trigger( 0 ) ;
SMA = Average( Price, Length ) ;
Mom = Momentum( Price, Length - 1 ) ;
SmoothMom = ( Mom + 2 * Mom[1] + 2 * Mom[2] +
 Mom[3] ) / 6 ;
ITrend = SMA + 0.5 * SmoothMom ;
DegPerBar = 360 / Length ;
CosineValue = Cosine( DegPerBar ) ;
if CosineValue <> 0 then
 Alpha = ( 1 - Sine ( DegPerBar ) ) / CosineValue ;
OneBarDiff = Price - Price[1] ;
HP = 0.5 * ( 1 + Alpha ) * OneBarDiff +
 Alpha * HP[1] ;
SmoothHP = ( HP + 2 * HP[1] + 2 * HP[2] + HP[3] ) / 6 ;
if CurrentBar = 1 then
 SmoothHP = 0
else if CurrentBar < 4 then
 SmoothHP = OneBarDiff ;
Synth = ITrend + SmoothHP ;
CU = 0 ;
CD = 0 ;
for Count = 0 to RSILen - 1
 begin
 CntPlus1 = Count + 1 ;
 if Synth[Count] > Synth[CntPlus1] then
  CU = CU + Synth[Count] - Synth[CntPlus1]
 else if Synth[Count] < Synth[CntPlus1] then
  CD = CD + Synth[CntPlus1] - Synth[Count] ;
 end ;
CU = CU / RSILen ;
CD = CD / RSILen ;
CUAve = CU ;
CDAve = CD ;
if CUAve <> -CDAve then
 RSI0 = CUAve / ( CUAve + CDAve ) ;
if CurrentBar > 1 then
 begin
 RSILenLess1 = RSILen - 1 ;
 CUAve = ( CUAve[1] * RSILenLess1 + CU ) / RSILen ;
 CDAve = ( CDAve[1] * RSILenLess1 + CD ) / RSILen ;
 end ;
if CUAve <> -CDAve then
 RSI0 = CUAve / ( CUAve + CDAve ) ;
HiR = Highest( RSI0, StochLen ) ;
LoR = Lowest( RSI0, StochLen ) ;
if HiR <> LoR then
 StochR = ( RSI0 - LoR ) / ( HiR - LoR ) ;
StochRSI = 0 ;
StochRSIDiv = 0 ;
for Count = 0 to WAveLen - 1
 begin
 StochRSI = StochRSI + ( WAveLen - Count ) *
  StochR[Count] ;
 StochRSIDiv = StochRSIDiv + Count + 1 ;
 end ;
if StochRSIDiv <> 0 then
 StochRSI = StochRSI / StochRSIDiv ;
Trigger = 0.05 + 0.9 * StochRSI[1] ;
if StochRSI crosses over Trigger then
 Buy next bar market
else if StochRSI crosses under Trigger then
 Sell short next bar at market ;
--Mark Mills
TradeStation Securities, Inc.
A subsidiary of TradeStation Group, Inc.
www.TradeStationWorld.com
METASTOCK: MODELING THE MARKET
John Ehlers' article in this issue, "Modeling The Market = Building Trading Strategies," presents three new indicators. These indicators and their formulas for MetaStock are shown here.
To enter these indicators into MetaStock, perform the following:
1. In the Tools menu, select Indicator Builder.
2. Click "New" to open the Indicator Editor for a new indicator.
3. Type the name of the formula.
4. Click in the larger window and type in the formula.
5. Click OK to close the Indicator Editor.
GO BACKName: Instantaneous Trendline Formula: pr:=MP(); len:=20; sma:=Mov(pr,len,S); sl:=pr-Ref(pr,-(len-1)); ssl:= (sl+(2*Ref(sl,-1))+(2*Ref(sl,-2))+Ref(sl,-3))/6; sma+(0.5*ssl) Name: cyclic component Formula: pr:=MP(); len:=20; a:=(1-Sin(360/len))/Cos(360/len); hp:=(0.5*(1+a)*(pr-Ref(pr,-1)))+(a*PREV); shp:= (hp+(2*Ref(hp,-1))+(2*Ref(hp,-2))+Ref(hp,-3))/6; shp Name: Modeling the Market Formula: pr:=MP(); len:=20; sma:=Mov(pr,len,S); sl:=pr-Ref(pr,-(len-1)); ssl:= (sl+(2*Ref(sl,-1))+(2*Ref(sl,-2))+Ref(sl,-3))/6; a:=(1-Sin(360/len))/Cos(360/len); hp:=(0.5*(1+a)*(pr-Ref(pr,-1)))+(a*PREV); shp:= (hp+(2*Ref(hp,-1))+(2*Ref(hp,-2))+Ref(hp,-3))/6; sma+(0.5*ssl)+shp--William Golson
Equis International
eSIGNAL: MODELING THE MARKET
For this month's article by John Ehlers, "Modeling The Market = Building Trading Strategies," we've provided three eSignal formula scripts: InstantaneousTrendLine.efs, CyclicComponent.efs, and Model.efs.
The instantaneous trendline (Itl) and cyclic component (CC) studies each have one formula parameter for the period length that may be configured through the Edit Studies option in the Advanced Chart. The model study has two length parameters, one for each the Itl and CC. The lengths for these two components of the model study can be set at different values. See Figure 2 for an example of the model indicator.
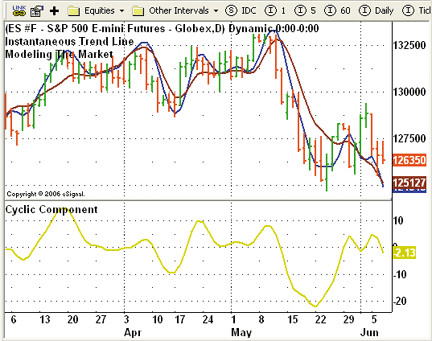
FIGURE 2: eSIGNAL, MODELING INDICATOR. Here is a demonstration of John Ehlers' model indicator in eSignal.To discuss this study or download a complete copy of the formula, please visit the EFS Library Discussion Board forum under the Bulletin Boards link at www.esignalcentral.com. You will also find there an example formula of the StochOfRsi.efs in the EFS Library under the "oscillators" category that is similar to the stochastic of RSI mentioned in the article.
GO BACK/*************************************** Provided By : eSignal (c) Copyright 2006 Description: Modeling The Market = Building Trading Strategies by John F. Ehlers Version 1.0 06/05/2006 Notes: * Aug 2006 Issue of Stocks and Commodities Magazine * Study requires version 8.0.0 or higher. Formula Parameters: Defaults: Length 20 ***************************************/ function preMain() { setStudyTitle("Cyclic Component "); setCursorLabelName("CC", 0); setShowTitleParameters(false); setDefaultBarFgColor(Color.khaki, 0); setDefaultBarThickness(2, 0); var fp1 = new FunctionParameter("nLength", FunctionParameter.NUMBER); fp1.setName("Length"); fp1.setLowerLimit(0); fp1.setDefault(20); } var bVersion = null; var bInit = false; var nAlpha = null; var xHL2 = null; var xHP = null; var nHP_1 = null; var nHP_0 = null; function main(nLength) { if (bVersion == null) bVersion = verify(); if (bVersion == false) return; if (bInit == false) { nAlpha = (1 - Math.sin((2*Math.PI)/nLength)) / Math.cos((2*Math.PI)/nLength); xHL2 = hl2(); xHP = efsInternal("calcHP", xHL2, nAlpha); bInit = true; } var nSmoothHP = null; if (xHP.getValue(-3) == null || xHL2.getValue(-1) == null) return; nSmoothHP = (xHP.getValue(0) + (2*xHP.getValue(-1)) + (2*xHP.getValue(-2)) + xHP.getValue(-3)) /6; return nSmoothHP; } function calcHP(x, a) { if (nHP_1 == null) { nHP_1 = 0; return; } else if (getBarState() == BARSTATE_NEWBAR) { nHP_1 = nHP_0; } nHP_0 = (.5 * (1 + a) * (x.getValue(0) - x.getValue(-1)) + (a * nHP_1) ); return nHP_0; } function verify() { var b = false; if (getBuildNumber() < 750) { drawTextAbsolute(5, 35, "This study requires version 8.0.0 or later.", Color.white, Color.blue, Text.RELATIVETOBOTTOM|Text.RELATIVETOLEFT|Text.BOLD|Text.LEFT, null, 13, "error"); drawTextAbsolute(5, 20, "Click HERE to upgrade.@URL=https://www.esignal.com/download/default.asp", Color.white, Color.blue, Text.RELATIVETOBOTTOM|Text.RELATIVETOLEFT|Text.BOLD|Text.LEFT, null, 13, "upgrade"); return b; } else { b = true; } return b; } /*************************************** Provided By : eSignal (c) Copyright 2006 Description: Modeling The Market = Building Trading Strategies by John F. Ehlers Version 1.0 06/05/2006 Notes: * Aug 2006 Issue of Stocks and Commodities Magazine * Study requires version 8.0.0 or higher. Formula Parameters: Defaults: Length 20 ***************************************/ function preMain() { setPriceStudy(true); setStudyTitle("Instantaneous Trend Line "); setCursorLabelName("ITL", 0); setShowTitleParameters(false); setDefaultBarFgColor(Color.maroon, 0); setDefaultBarThickness(2, 0); var fp1 = new FunctionParameter("nLength", FunctionParameter.NUMBER); fp1.setName("Length"); fp1.setLowerLimit(0); fp1.setDefault(20); } var bVersion = null; var bInit = false; var xHL2 = null; var xSMA = null; var xSlope = null; function main(nLength) { if (bVersion == null) bVersion = verify(); if (bVersion == false) return; if (bInit == false) { xHL2 = hl2(); xSMA = sma(nLength, hl2()); xSlope = efsInternal("calcSlope", xHL2, nLength); bInit = true; } var nSmoothSlope = null; var ITrend = null; if (xSlope.getValue(-3) == null) return; nSmoothSlope = (xSlope.getValue(0) + (2* xSlope.getValue(-1)) + (2* xSlope.getValue(-2)) + xSlope.getValue(-3)) / 6; ITrend = xSMA.getValue(0) + (.5 * nSmoothSlope); return ITrend; } function calcSlope(x, n) { if (x.getValue(-(n-1)) == null) return; return (x.getValue(0) - x.getValue(-(n-1)) ); } function verify() { var b = false; if (getBuildNumber() < 750) { drawTextAbsolute(5, 35, "This study requires version 8.0.0 or later.", Color.white, Color.blue, Text.RELATIVETOBOTTOM|Text.RELATIVETOLEFT|Text.BOLD|Text.LEFT, null, 13, "error"); drawTextAbsolute(5, 20, "Click HERE to upgrade.@URL=https://www.esignal.com/download/default.asp", Color.white, Color.blue, Text.RELATIVETOBOTTOM|Text.RELATIVETOLEFT|Text.BOLD|Text.LEFT, null, 13, "upgrade"); return b; } else { b = true; } return b; } /*************************************** Provided By : eSignal (c) Copyright 2006 Description: Modeling The Market = Building Trading Strategies by John F. Ehlers Version 1.0 06/05/2006 Notes: * Aug 2006 Issue of Stocks and Commodities Magazine * Study requires version 8.0.0 or higher. Formula Parameters: Defaults: ITL Length 20 CC Length 20 ***************************************/ function preMain() { setPriceStudy(true); setStudyTitle("Modeling The Market "); setCursorLabelName("Model", 0); setShowTitleParameters(false); setDefaultBarFgColor(Color.blue, 0); setDefaultBarThickness(2, 0); var fp1 = new FunctionParameter("nLength_ITL", FunctionParameter.NUMBER); fp1.setName("ITL Length"); fp1.setLowerLimit(0); fp1.setDefault(20); var fp2 = new FunctionParameter("nLength_CC", FunctionParameter.NUMBER); fp2.setName("CyclicC Length"); fp2.setLowerLimit(0); fp2.setDefault(20); } var bVersion = null; var bInit = false; var nAlpha = null; var xHL2 = null; var xHP = null; var nHP_1 = null; var nHP_0 = null; var xSMA = null; var xSlope = null; function main(nLength_ITL, nLength_CC) { if (bVersion == null) bVersion = verify(); if (bVersion == false) return; if (bInit == false) { //nAlpha = (1 - Math.sin(360/nLength)) / Math.cos(360/nLength); /*************************************************************** Math.sin and Math.cos in JavaScript are represented in Radians, TradeStations returns degrees. To convert Math.sin(360/n) to Radians, replace 360 with (2*Math.PI). Or to convert Degrees to Radians => (Number * Math.PI) / 180 ***************************************************************/ nAlpha = (1 - Math.sin((2*Math.PI)/nLength_CC)) / Math.cos((2*Math.PI)/nLength_CC); xHL2 = hl2(); xSMA = sma(nLength_ITL, hl2()); xSlope = efsInternal("calcSlope", xHL2, nLength_ITL); xHP = efsInternal("calcHP", xHL2, nAlpha); bInit = true; } var nSmoothHP = null; var nSmoothSlope = null; var ITrend = null; var Model = null; if (xHP.getValue(-3) == null || xHL2.getValue(-1) == null) return; nSmoothHP = (xHP.getValue(0) + (2*xHP.getValue(-1)) + (2*xHP.getValue(-2)) + xHP.getValue(-3)) /6; if (xSlope.getValue(-3) == null) return; nSmoothSlope = (xSlope.getValue(0) + (2* xSlope.getValue(-1)) + (2* xSlope.getValue(-2)) + xSlope.getValue(-3)) / 6; ITrend = xSMA.getValue(0) + (.5 * nSmoothSlope); Model = ITrend + nSmoothHP; return Model; } function calcHP(x, a) { if (nHP_1 == null) { nHP_1 = 0; return; } else if (getBarState() == BARSTATE_NEWBAR) { nHP_1 = nHP_0; } nHP_0 = (.5 * (1 + a) * (x.getValue(0) - x.getValue(-1)) + (a * nHP_1) ); return nHP_0; } function calcSlope(x, n) { if (x.getValue(-(n-1)) == null) return; return (x.getValue(0) - x.getValue(-(n-1)) ); } function verify() { var b = false; if (getBuildNumber() < 750) { drawTextAbsolute(5, 35, "This study requires version 8.0.0 or later.", Color.white, Color.blue, Text.RELATIVETOBOTTOM|Text.RELATIVETOLEFT|Text.BOLD|Text.LEFT, null, 13, "error"); drawTextAbsolute(5, 20, "Click HERE to upgrade.@URL=https://www.esignal.com/download/default.asp", Color.white, Color.blue, Text.RELATIVETOBOTTOM|Text.RELATIVETOLEFT|Text.BOLD|Text.LEFT, null, 13, "upgrade"); return b; } else { b = true; } return b; }--Jason Keck
eSignal, a division of Interactive Data Corp.
800 815-8256, www.esignalcentral.com
AIQ: MODELING THE MARKET
The AIQ code for John Ehlers' set of indicators described in "Modeling The Market = Building Trading Strategies" is shown here. The AIQ chart in Figure 3 shows the three indicators plotted beneath a chart of the Standard & Poor's 500.
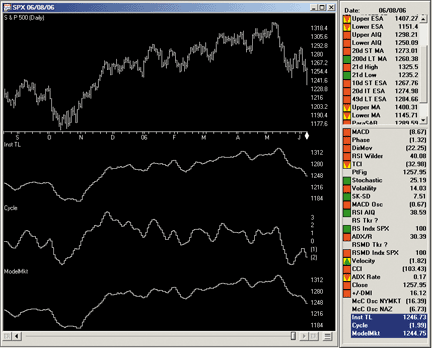
FIGURE 3: AIQ SYSTEMS, EHLERS INDICATORS. Here are the instantaneous trendline, cyclic component, and market model indicators.
!!! MODELING THE MARKET, TASC August 2006
!!  Author: John F. Ehlers
!!  Coded by: Richard Denning 6/08/06
!! INSTANANEOUS TRENDLINE
C is [close].
H is [high].
L is [low].
Price is (H+L)/2.
LL is 20.
SMA is simpleavg(Price,LL).
Slope is Price - valresult(Price,LL - 1).
sSlope is (Slope + 2 * valresult(Slope,1)
       + 2 * valresult(Slope,3) + valresult(Slope,3)) / 6.
ITrend is SMA + 0.5 * sSlope.
!! CYCLIC COMPONENT
SS is 2 * LL +1.
Alpha is (1 - sin(360 / LL)) / cos(360 / LL).
HP is expavg((1 + alpha) * (Price - valresult(Price,1)),SS).
sHP is (HP + 2 * valresult(HP,1)
      + 2 * valresult(HP,2) + valresult(HP,3)) / 6.
!! MODELING THE MARKET
Model is ITrend + sHP.
This code can be downloaded from the AIQ website at www.aiqsystems.com.
--Richard DenningGO BACK
AIQ Systems
richard.denning@earthlink.net
WEALTH-LAB: MODELING THE MARKET
We created a ChartScript based on the instantaneous trendline indicator described in John Ehlers' article, "Modeling The Market = Building Trading Strategies." The instantaneous trendline indicator and the cyclic component indicator are now part of the Wealth-Lab Code Library.
We chose to develop a trend-following system and used one of the methods suggested by Ehlers. The system compares the instantaneous trendline with its two-day delayed version and takes action as soon as one line crosses over the other. The cyclical component is plotted for information purposes but not used in the trading rules (Figure 4).
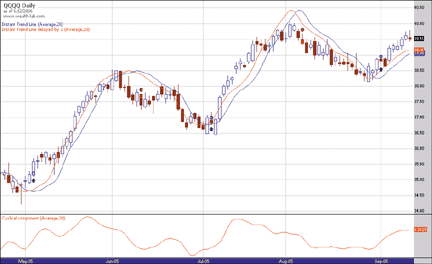
FIGURE 4: WEALTH-LAB, EHLERS INDICATORS. In this sample price chart, the upper pane contains the instantaneous trendline (blue) together with a copy shifted by two days (red). The lower pane contains the cyclical component. All indicators use 20 days as a lookback period and the average price (H+L)/2 as a parameter. The system enters the market as soon as the red indicator crosses over the blue one. The chart shows various profitable trades from May through September 2005 in the QQQQ when a variety of up- and downtrends occurred.
GO BACKWealthScript code: {$I 'CyclicComponent'} var Bar: integer; var CCPane: integer = CreatePane(100, false, false); var CC: integer = CyclicComponentSeries(#Average, 20); var ITL: integer = InstantaneousTrendLineSeries(#Average, 20); var ITL1: integer = OffsetSeries(ITL, 2); PlotSeriesLabel(ITL, 0, #Blue, #Thin, 'Instant Trend Line (Average,20)'); PlotSeriesLabel(ITL1, 0, #Red, #Thin, 'Instant Trend Line delayed by 2 (Average,20)'); PlotSeriesLabel(CC, CCPane, #Red, #Thin, 'Cyclical component (Average,20)'); HideVolume; for Bar := 20 to BarCount - 1 do begin if not LastPositionActive then begin If CrossOver(Bar, ITL1, ITL) then BuyAtMarket(Bar + 1, 'Uptrend signal'); end else begin If CrossUnder(Bar, ITL1, ITL) then SellAtMarket(Bar + 1, LastPosition, 'Downtrend signal'); end; end;
-- José Cruset
www.wealth-lab.com
AMIBROKER: MODELING THE MARKET
In "Modeling The Market = Building Trading Strategies," John Ehlers
presents an enhancement of his previous developments -- a market model composed
of trend and cycle components (Figure 5). The coding for such a model in
AmiBroker Formula Language (Afl) is straightforward. The ready-to-use formula
for AmiBroker is presented in Listing 1. To apply the formula, please open
Formula Editor, paste in the code, and press the "Apply Indicator" button.
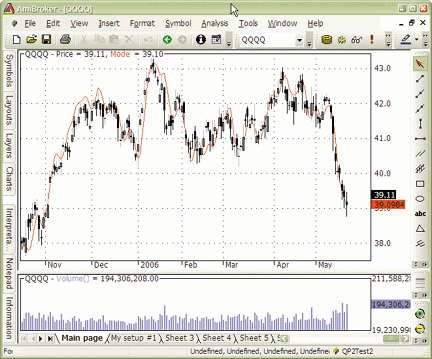
FIGURE 5: AMIBROKER, EHLERS INDICATORS. Here are the instantaneous trendline, cyclic component, and market model indicators.
LISTING 1
// Instantaneous Trendline
Price = (H+L)/2;
Length = Param("Length", 20, 2, 100, 1 );
SMA = MA( Price, Length );
Slope = Price - Ref( Price, - ( Length - 1 ) );
SmoothSlope = ( Slope + 2 * Ref( Slope, -1 )
 + 2 * Ref( Slope, -2 ) + Ref( Slope, -3 ) )/6;
ITrend = SMA + 0.5 * SmoothSlope;
// Cyclic Component
alpha = 0;
HP = 0;
SmoothHP = 0;
PI = 3.1415926;
alpha = ( 1 - sin( 2 * PI / Length ) )/cos( 2 * PI / Length );
HP = AMA2( Price - Ref( Price, -1 ), 0.5 * ( 1 + alpha ), alpha );
SmoothHP = ( HP + 2 * Ref( HP, -1 )
 + 2 * Ref( HP, -2 ) + Ref( HP, -3 ) ) / 6;
Plot( Price, "Price", colorBlack, styleCandle );
// components of model
// Plot( ITrend, "ITrend", colorRed );
// Plot( SmoothHP, "SmoothHP", colorRed );
Model = ITrend + SmoothHP;
Plot( Model, "Model", colorRed );
--Tomasz Janeczko, AmiBroker.comGO BACK
www.amibroker.com
NEUROSHELL TRADER: MODELING THE MARKET
The indicators described in John Ehlers' article "Modeling The Market = Building Trading Strategies" can be easily implemented in NeuroShell Trader using NeuroShell Trader's ability to call external dynamic linked libraries (DLLs). Dynamic linked libraries can be written in C, C++, Power Basic, Delphi, and IBasic. See Figure 6 for an example.
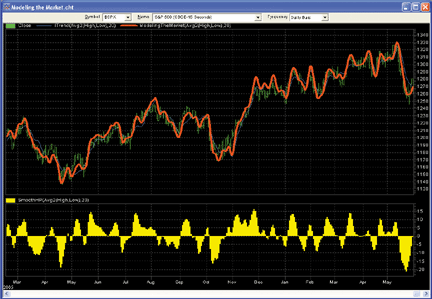
FIGURE 6: NeuroShell, EHLERS INDICATORS. This sample NeuroShell Trader chart displays John Ehlers' three indicators discussed in this issue: modeling the market indicator, the instantaneous trendline, and the cyclical component indicators.
After moving the EasyLanguage code given in the article to your
preferred compiler and creating a DLL, you can insert the resulting instantaneous
trendline, cyclical component, and modeling the market indicators as follows:
1. Select "New Indicator ..." from the Insert menu.
2. Select the Custom Indicator category.
3. Select the desired indicator.
4. Select the parameters as you desire.
5. Select the "Finished" button.
If you decide to use the modeling the market indicators in a prediction
or a trading strategy, the parameters can be optimized by the genetic algorithm
built into NeuroShell Trader Professional.
It should be noted that John Ehler's Mesa8 cycle measuring indicators and cybernetic analysis indicators are also available as add-ons to NeuroShell Trader. For more information on these add-ons or NeuroShell Trader, visit www.NeuroShell.com.
Users of NeuroShell Trader can go to the STOCKS & COMMODITIES section of the NeuroShell Trader free technical support website to download a copy of this or previous Traders' Tips.
--Marge Sherald, Ward Systems Group, Inc.GO BACK
301 662-7950, sales@wardsystems.com
www.neuroshell.com
NEOTICKER: MODELING THE MARKET
In "Modeling The Market = Building Trading Strategies," John Ehlers presents three indicators: the instantaneous trendline (Listing 1), the cyclic component (Listing 2), and modeling the market (Listing 3). All three indicators can be implemented in NeoTicker using formula language. All three have two parameters: price and length. Price is a formula parameter defaulted to (high+low)/2, and length is an integer parameter with a default of 20.
Trading signals that are based on the instantaneous trendline are generated by a crossover of a one-period delay and the actual. To test this trading idea, a simple stop-and-reverse system can be built using Backtest EZ (Figure 7). The long and short signals (Listing 4) are written in NeoTicker formula language.
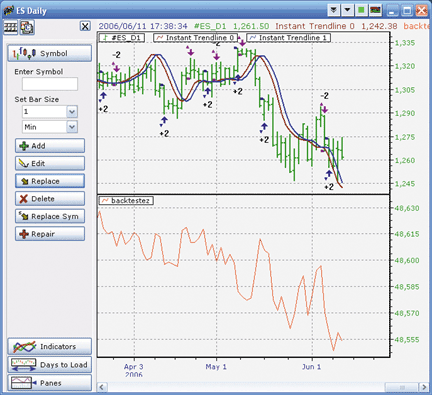
FIGURE 7: NEOTICKER, INSTANTANEOUS TRENDLINE. Trading signals based on John Ehlers' instantaneous trendline indicator are generated by a crossover of a one-period delay and the actual. To test the method, a simple stop-and-reverse system can be built using Backtest EZ (lower pane).
Downloadable versions of these indicators and a chart group with
backtest EZ will be available at the NeoTicker blog site (https://blog.neoticker.com).
LISTING 1
$Length := param2;
MyPrice := fml(data1, param1);
$SMA := average(MyPrice, $Length);
Slope := MO(MyPrice, $Length);
$SmoothSlope := (Slope + 2*Slope(1) + 2*Slope(2) + Slope(3))/6;
plot1 := $SMA+0.5*$SmoothSlope;
LISTING 2
$Length := param2;
myPrice := fml(data1, param1);
$alpha := frac((1-sin(360/$Length))/cos(360/$Length));
HP := 0.5*(1+$alpha)*(myPrice-myPrice(1))+$alpha*HP(1);
$SmoothHP := (HP+2*HP(1)+2*HP(2)+HP(3))/6;
plot1 := choose(CurrentBar=1, 0,
                CurrentBar<4, MyPrice-MyPrice(1), $SmoothHP);
LISTING 3
$Length := param2;
myPrice := fml(data1, param1);
$mySMA := average(myPrice, $Length);
mySlope := myPrice - myPrice(1);
$SmoothSlope := (mySlope + 2*mySlope(1) + 2*mySlope(2) + mySlope(3))/6;
$ITrend := $mySMA + $SmoothSlope;
$myalpha := frac((1-sin(360/$Length))/cos(360/$Length));
HP := 0.5*(1+$myalpha)*(myPrice - myPrice(1))+$myalpha*HP(1);
$SmoothHP := choose(Currentbar(0) = 1, 0, Currentbar(1) < 4,
             myPrice-myPrice(1), (HP+2*HP(1)+2*HP(2)+HP(3))/6);
plot1 := $ITrend;
plot2 := $SmoothHP;
plot3 := $ITrend + $SmoothHP;
LISTING 4
Long Entry: xabove(tasc_instantTL(1,data1,"(h+l)/2",20), tasc_instantTL(0,data1,"(h+l)/2",20))
Short Entry: xbelow (tasc_instantTL(1,data1,"(h+l)/2",20),
tasc_instantTL(0,data1,"(h+l)/2",20))
--Kenneth Yuen, TickQuest Inc.GO BACK
www.tickquest.com
MULTICHARTS: MODELING THE MARKET
MultiCharts' scripting language is compatible with EasyLanguage, and this means that you can use the TradeStation code provided in John Ehlers' article "Modeling The Market = Building Trading Strategies" in MultiCharts. Figure 8 shows an example of applying all three indicators described in the article to MultiCharts.
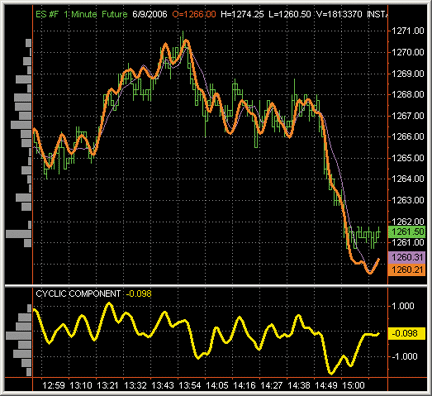
FIGURE 8: MULTICHARTS, EHLERS INDICATORS. Here is a sample chart of the emini S&P 500 continuous contract. The instantaneous trendline (purple), the cyclic component indicator (yellow), and complete model (orange) as an indicator have all been applied to the chart.
To discuss this article and download a complete copy of the formulas,
please visit our discussion forum at forum.tssupport.com.
--Stanley MillerGO BACK
TS Support, Llc
www.tssupport.com
TRADING SOLUTIONS: MODELING THE MARKET
In his article "Modeling The Market = Building Trading Strategies," John Ehlers presents a way to model the market based on extracting the underlying cyclic component from the instantaneous trendline.
These functions can be entered into TradingSolutions as described here.
These functions are also available as a function file that can be downloaded
from the TradingSolutions website (www.tradingsolutions.com) in the Solution
Library section.
Function Name: Ehlers Smoothing
Short Name: ESmoothing
Inputs: Data
Div (Add (Data, Add (Mult (2, Lag (Data, 1)), Add (Mult (2, Lag (Data, 2)), Lag (Data, 3)))), 6)
Function Name: Ehlers Slope
Short Name: ESlope
Inputs: Data, Period, Maximum Period
Sub (Data, LagVL (Data, Sub (Period, 1), Maximum Period))
Function Name: Ehlers Instantaneous Trendline
Short Name: EITrend
Inputs: Data, Period, Maximum Period
Add (MAVL (Data, Period, Maximum Period), Mult (0.5, ESmoothing (ESlope (Data, Period, Maximum Period))))
Function Name: Ehlers Cyclic Component HP
Short Name: ECycleHP
Inputs: Data, Period
Add (Mult (0.5, Mult (Add (1, Div (Sub (1, Sin (DtoR (Div (360, Period)))),
 Cos (DtoR (Div (360, Period))))), Change (Data,1))), Mult (Div (Sub (1,
 Sin (DtoR (Div (360, Period)))), Cos (DtoR (Div (360, Period)))), Prev (1)))
Function Name: Ehlers Cyclic Component SmoothHP
Short Name: ESmoothHP
Inputs: Data, Period
If (EQ (Bar# ( ), 1), 0, If (LT (Bar# ( ), 4), Change (Data, 1), ESmoothing (ECycleHP (Data, Period))))
Function Name: Ehlers Model
Short Name: EModel
Inputs: Data, Period, Maximum Period
Add (EITrend (Data, Period, Maximum Period), ESmoothHP (Data, Period))
These individual formulas can be used to create fields that can
be displayed in a chart with closing price. They can also be used as optimizable
inputs to a neural network or as optimizable elements of entry/exit system
rules.
--Gary GeniesseGO BACK
NeuroDimension, Inc.
800 634-3327, 352 377-5144
www.tradingsolutions.com
BIOCOMP DAKOTA: MODELING THE MARKET
In his article "Modeling The Market = Building Trading Strategies," author John Ehlers shows us how to create a market model using the instantaneous trend and cycle components. In BioComp Dakota, you can easily recreate this trading system by calling the EhlersInstTrend and EhlersHP functions. However, we found the system to be most effective countertrading, which means if today's value is greater than yesterday, you short the emini S&P 500 futures contract and vice versa.
Dakota's VB Script code for a "pessimist" (countertrader) version of
Ehlers' trading system is rather simple:
Running an adaptive swarm of 25 of these trading "bots" on the emini S&P 500 futures contract using Pinnacle Data's ES.Rad ratio-reverse adjusted data walking forward over the last five years, we achieve 67% winning trades and we gain about 590 points per contract, where the emini contract loses about15 points. As we can see in the screenshot in Figure 9, while it's not the smoothest equity curve, it is a reasonably straight one.Function Script_CreateSignal(Prices()) Dim Signal 'This is the value you are going to calculate Dim Ehlers PriceCtr = PriceCtr + 1 Redim Preserve PriceHistory(PriceCtr) PriceHistory(PriceCtr) = Prices(2) Ehlers = Dakota.EhlersInstTrend(PriceHistory, ParameterValue(1)) + Dakota.EhlersHP(PriceHistory, ParameterValue(2)) if PriorEhlers = 0 then PriorEhlers = Ehlers end if Signal = PriorEhlers - Ehlers PriorEhlers = Ehlers Script_CreateSignal = Signal Exit Function End Function
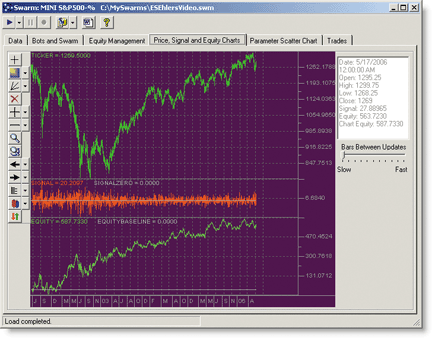
FIGURE 9: BIOCOMP DAKOTA, EHLERS INDICATORS. Here is a sample chart showing price, trading signals, and the equity curve for a swarm of "Ehlers InstiTrend Pessimist" Bots on the emini S&P 500 futures contract.
Dakota users can download this bot from the downloads page of the
private BioComp Dakota website at www.biocompsystems.com/products/Dakota/.
--Carl Cook, BioComp Systems, Inc.GO BACK
www.biocompsystems.com
952 746-5761
VT TRADER: MODELING THE MARKET
John F. Ehlers's article in this issue, "Modeling the Market = Building Trading Strategies" discusses the benefits of isolating (and then adding back together) the market's trend component and cyclic component to "synthesize a reasonable representation of the market". Ehlers describes two indicators suited for this purpose: the Instantaneous Trendline indicator (for isolating the trend) and the Cyclic Component indicator (for isolating the cycles). When combined, these indicators create the final "Model of the Market" indicator. We'll be offering all three indicators for download in our user forums. The VT Trader code and instructions for creating the indicators are as follows (input variables are parameterized to allow customization):
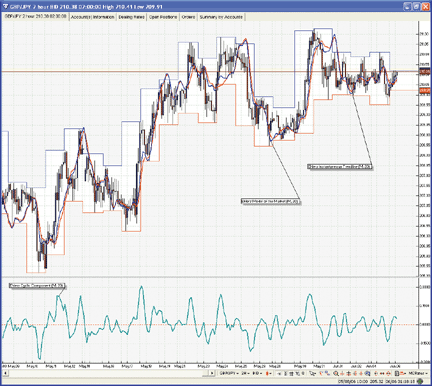
GO BACKFIGURE 10: VT TRADER, EHLERS INDICATORS. This chart demonstrates John Ehlers' instantaneous trendline (red line) and model of the market (blue line) indicators overlaid on the price candles; Ehlers' cyclic component indicator is displayed in its own frame below the price frame.Instantaneous Trendline Indicator: 1. Navigator Window>Tools>Indicator Builder>[New] button 2. In the Indicator Bookmark, type the following text for each field: Name: TASC - 08/2006 - Ehlers Modeling The Market (Instantaneous Trendline) Short Name: vt_EhlersiTrend Label Mask: Ehlers Instantaneous Trendline (%Price%, %Periods%) Placement: Price Frame Inspect Alias: Ehlers Instantaneous Trendline 3. In the Input Bookmark, create the following variables: [New] button... Name: Price , Display Name: Price , Type: price , Default: Median Price [New] button... Name: Periods , Display Name: Periods , Type: integer , Default: 20 4. In the Output Bookmark, create the following variables: [New] button... Var Name: iTrend Name: (iTrend) Line Color: red Line Width: slightly thicker Line Type: solid line 5. In the Formula Bookmark, copy and paste the following formula: {Provided By: Visual Trading Systems, LLC (c) Copyright 2006} {Description: Modeling The Market = Building Trading Strategies by John F. Ehlers} {Notes: August 2006 Issue - Modeling The Market = Building Trading Strategies} {vt_EhlersiTrend Version 1.0} SMA:= mov(Price,Periods,S); Slope:= Price - ref(Price,-(Periods-1)); SmoothSlope:= (Slope + 2 * ref(Slope,-1) + 2 * ref(Slope,-2) + ref(Slope,-3)) / 6; iTrend:= SMA + 0.5 * SmoothSlope; 6. Click the "Save" icon to finish building the Instantaneous Trendline indicator. To attach the iTrend indicator to a chart click the right mouse button within the chart window and then select "Add Indicators" -> "TASC - 08/2006 - Ehlers Modeling The Market (Instantaneous Trendline)" from the indicator list. Cyclic Component Indicator: 1. Navigator Window>Tools>Indicator Builder>[New] button 2. In the Indicator Bookmark, type the following text for each field: Name: TASC - 08/2006 - Ehlers Modeling The Market (Cyclic Component) Short Name: vt_EhlersCyclicComp Label Mask: Ehlers Cyclic Component (%Price%, %Periods%) Placement: New Frame Inspect Alias: Ehlers Cyclic Component 3. In the Input Bookmark, create the following variables: [New] button... Name: Price , Display Name: Price , Type: price , Default: Median Price [New] button... Name: Periods , Display Name: Periods , Type: integer , Default: 20 4. In the Output Bookmark, create the following variables: [New] button... Var Name: SmoothHP Name: (Cyclic Component) Line Color: dark green Line Width: slightly thicker Line Type: solid line 5. In the Formula Bookmark, copy and paste the following formula: {Provided By: Visual Trading Systems, LLC (c) Copyright 2006} {Description: Modeling The Market = Building Trading Strategies by John F. Ehlers} {Notes: August 2006 Issue - Modeling The Market = Building Trading Strategies} {vt_EhlersCyclicComp Version 1.0} CurrentBar:= BarCount(); alpha:= (Cos(360/Periods) + Sin(360/Periods)-1)/Cos(360/Periods); HP:= 0.5 * (1+alpha) * (Price - ref(Price,-1)) + alpha * PREV; SmoothHP:= if(CurrentBar=1,0, if(CurrentBar<4,Price-ref(Price,-1), (HP + 2 * ref(HP,-1) + ref(HP,-2) + ref(HP,-3)) / 6)); 6. Click the "Save" icon to finish building the Cyclic Component indicator. To attach the Cyclic Component indicator to a chart click the right mouse button within the chart window and then select "Add Indicators" -> "TASC - 08/2006 - Ehlers Modeling The Market (Cyclic Component)" from the indicator list. Model of the Market Indicator 1. Navigator Window>Tools>Indicator Builder>[New] button 2. In the Indicator Bookmark, type the following text for each field: Name: TASC - 08/2006 - Ehlers Modeling The Market (Model of the Market) Short Name: vt_EhlersMarketModel Label Mask: Ehlers Model of the Market (%Price%, %Periods%) Placement: Price Frame Inspect Alias: Ehlers Market Model 3. In the Input Bookmark, create the following variables: [New] button... Name: Price , Display Name: Price , Type: price , Default: Median Price [New] button... Name: Periods , Display Name: Periods , Type: integer , Default: 20 4. In the Output Bookmark, create the following variables: [New] button... Var Name: Model Name: (Model) Line Color: blue Line Width: slightly thicker Line Type: solid line 5. In the Formula Bookmark, copy and paste the following formula: {Provided By: Visual Trading Systems, LLC (c) Copyright 2006} {Description: Modeling The Market = Building Trading Strategies by John F. Ehlers} {Notes: August 2006 Issue - Modeling The Market = Building Trading Strategies} {vt_EhlersMarketModel Version 1.0} {Ehlers Instantaneous Trendline} SMA:= mov(Price,Periods,S); Slope:= Price - ref(Price,-(Periods-1)); SmoothSlope:= (Slope + 2 * ref(Slope,-1) + 2 * ref(Slope,-2) + ref(Slope,-3)) / 6; iTrend:= SMA + 0.5 * SmoothSlope; {Ehlers Cyclic Component} CurrentBar:= BarCount(); alpha:= (Cos(360/Periods) + Sin(360/Periods)-1)/Cos(360/Periods); HP:= 0.5 * (1+alpha) * (Price - ref(Price,-1)) + alpha * PREV; SmoothHP:= if(CurrentBar=1,0,if(CurrentBar<4,Price-ref(Price,-1), (HP + 2 * ref(HP,-1) + ref(HP,-2) + ref(HP,-3)) / 6)); {Ehlers Model of the Market} Model:= iTrend + SmoothHP; 6. Click the "Save" icon to finish building the Model of the Market indicator. To attach the Model of the Market indicator to a chart click the right mouse button within the chart window and then select "Add Indicators" -> "TASC - 08/2006 - Ehlers Modeling The Market (Model of the Market)" from the indicator list.
To learn more about the VT Trader, please visit www.cmsfx.com.- Chris Skidmore
Visual Trading Systems, LLC (courtesy of CMS Forex)
(866) 51-CMSFX, trading@cmsfx.com
TRADECISION: MODELING THE MARKET
In his article "Modeling The Market = Building Trading Strategies," John Ehlers illustrates the value of modeling the market while developing comprehensive trading strategies. By using the Indicator Builder in Tradecision, you can recreate Ehlers' cyclic component, instantaneous trendline, and market model indicators and use them to build trading strategies that combine the techniques with other indicator-based and money management rules.
Note: You can use the Tradecision Optimization wizard to find the best parameters for your trading system.
Here is the code for the three indicators:
Cyclic component
Input
     Price: "Price", (H + l) / 2;
     Length: "Length", 20;
end_input
var
   Alpha := (1 ? Sin (360 / Length)) / Cos (360 / Length);
   HP := 0;
   SmoothHP := 0;
end_var
if (HistorySize > 1) then
   HP := 0.5 * (1 + alpha) * (Price - Price\1\) + Alpha * HP\1\;
else
   HP := 0;
if (HistorySize + 1) < 4 then
   SmoothHP := Price - Price\1\;
else
   SmoothHP := (HP + 2 * HP\1\ + 2 * HP\2\ + HP\3\) / 6;

if HistorySize = 0 then
   SmoothHP := 0;
return SmoothHP;
Instantaneous Trendline
Input
     Price: "Price", (H + l) / 2;
     Length: "Length", 20;
end_input
var
   SMA := SMA(Price, Length);
   Slope := Price - Price\Length - 1\;
   SmoothSlope := (Slope + 2 * Slope\1\ + 2 * Slope\2\ + Slope\3\) / 6;
   ITrend := SMA + 0.5 * SmoothSlope;
end_var
return ITrend;
Market Model
Input
     Price: "Price",(H +l) /2 ;
     Length: "Length", 20;
end_input
var
   Sma := SMA(Price, Length);
   Slope := Price - Price\Length - 1\;
   SmoothSlope := (Slope + 2 * Slope\1\ + 2 * Slope\2\ + Slope\3\) / 6;
   ITrend := SMA + 0.5 * SmoothSlope;
   Alpha := (1 - Sin(360 / Length)) / Cos(360 / Length);
   HP := 0;
   SmoothHP := 0;
end_var
if (HistorySize > 1) then
   HP := 0.5 * (1 + alpha) * (Price - Price\1\) + Alpha * HP\1\;
else
   HP := 0;
if (HistorySize + 1) < 4 then
   SmoothHP := Price - Price\1\;
else
   SmoothHP := (HP + 2 * HP\1\ + 2 * HP\2\ + HP\3\) / 6;

if HistorySize = 0 then
   SmoothHP := 0;
return ITrend + SmoothHP;
To download these indicators, visit the Traders' Tips area at https://tradecision.com/support/tasc_tips/tasc_traders_tips.htm.
--Alex GrechanowskiGO BACK
Alyuda Research, Inc.
alex@alyuda.com, 347 416-6083
www.alyuda.com, www.tradecision.com