Finding Directional Opportunities
Playing The Index Market
by Tom Gentile
Sometimes, it helps to look beyond the market averages and at specific sectors or industry groups instead
Quiet and trendless markets often leave index traders sidelined. Without volatility, trading indexes become more challenging because often-used strategies like bull call spreads or straddles simply don't work. These types of strategies require vertical movement. Unfortunately, falling volatility and sideways trading have become more frequent in the current market environment. Fortunately, ways to generate profits can still be found even when the overall market moves sideways.
One approach is to use a variety of strategies. Not all option strategies require vertical price movement. In fact, some do better in low-volatility situations or horizontal markets. For example, butterflies or calendar spreads are strategies that do best when markets trade within a range and without significant movement. So when faced with a sideways market, index traders can turn to strategies that work well in those market types.
Alternatively, when faced with a sideways market, rather than trading more familiar indexes like the Standard & Poor's 500 ($SPX) or the NASDAQ 100 (QQQQ), traders can focus instead on the variety of sector index products. It is this approach that we will discuss. In order to find directional trades in the index market, sometimes it helps to look beyond the usual market averages and at specific sectors or industry groups. Fortunately, index providers have developed an array of new products to work with. Unfortunately, the list has grown to the point that many traders simply can't make sense of all the different sector indexes and exchange traded funds available. Here's some help for those traders.
WHY TRADE SECTORS
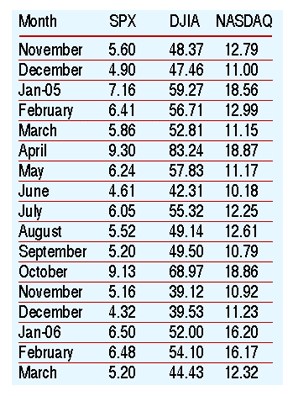
Although the S&P 500 ($SPX) recently rose to five-year highs, it has done so in quiet fashion. Figure 1 shows the average daily moves in the index (as well as the Dow Jones Industrial Average and NASDAQ) over the past 17 months. During March 2006, the average daily move in the index was only 5.2 points. I find it challenging to make profits from directional trades on an investment when its average daily move amounts to a minuscule 0.4%.

FIGURE 1: AVERAGE DAILY MOVE OF BROADER INDEXES. This chart shows the average daily moves in the index (as well as the DJIA and NASDAQ) over the past 17 months.
...Continued in the September issue of Technical Analysis of
STOCKS & COMMODITIES
Excerpted from an article originally published in the September 2006 issue of Technical Analysis of STOCKS & COMMODITIES magazine. All rights reserved. © Copyright 2006, Technical Analysis, Inc.
Return to September 2006 Contents