Doing The Cross-Street Shuffle
Trading With An Adaptive Price Zone
by Lee Leibfarth
When the markets are moving sideways, it is difficult to identify the turning points. Here's one indicator that can help you do that.
Traders are always looking for innovative ways to look at the markets, ones that will give them a unique edge. The adaptive price zone provides a means of analyzing price action and spotting possible turning points in the market. In addition, this type of indicator may help traders decide when to stay in the market and when to jump ship. While there is no magical indicator that can predict the direction of the markets with any great certainty, the adaptive price zone can project powerful thresholds that often lead to significant price moves.
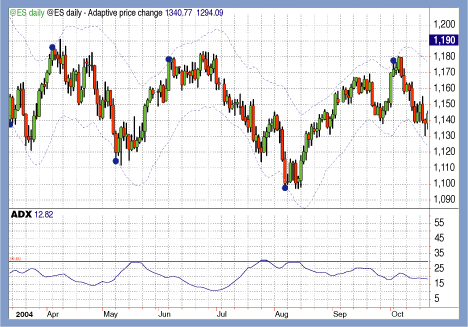
The adaptive price zone (APZ) forms a set of bands based on the calculations of a short-term double-smoothed exponential moving average. This forms a steady channel that surrounds the average price and tracks price fluctuations quickly, especially in volatile markets. This technical indicator can help traders find short-term trading opportunities in choppy markets since prices often bounce back and forth within this zone. As price crosses above or below the zone, it can signal an opportunity to buy or sell in anticipation of a reversal. This concept is shown in Figure 1, where the blue dots represent areas where price has violated the APZ.
HOW IT WORKS
To understand the concept of the APZ, you must first examine the importance of a moving average that tracks price action quickly and has little lag. For this I will use a double-smoothed exponential moving average (an exponential moving average of another exponential moving average) to form the basis for the APZ calculation. While simple moving averages (SMA) calculate a value by equally weighing every datapoint in the lookback period, they often fall significantly behind the current price (known as lag). To avoid this slow reaction, an exponential moving average (EMA) provides a faster method of averaging by giving more value (or weight) to the most recent prices in the lookback period. Using closing prices and taking a five-period EMA of another five-period EMA will provide a starting point for building the APZ.

FIGURE 1: THE ADAPTIVE PRICE ZONE. The daily chart of the emini S&P futures continuous contract shows how the adaptive price zone can point out reversals in a nontrending market. The blue dots represent reversal areas where price has violated the zone. On this chart, the number of periods = 30 and BandPct = 1.8.
The adaptive calculation that creates the zone is based on an average true range of sorts. Average true range (ATR), which was introduced by J. Welles Wilder, is a measure of market volatility. It is calculated by averaging the true range of price for a specific length (typically, 14 periods). For the purpose of the APZ, I will use an adaptive range instead of ATR to measure volatility. This can be created by taking the five-period double-smoothed EMA of the current high, minus the current low (see sidebar, "Adaptive price zone EasyLanguage code"). This provides a fast calculation of range that I will use to build the zone bands. Multiplying this value by a deviation factor (two, for instance) and adding and subtracting it from the double-smoothed EMA will complete the calculations for the APZ.
...Continued in the September issue of Technical Analysis of STOCKS & COMMODITIES
Excerpted from an article originally published in the September 2006 issue of Technical Analysis of STOCKS & COMMODITIES magazine. All rights reserved. © Copyright 2006, Technical Analysis, Inc.
Return to September 2006 Contents