One way to trade the NASDAQ Composite is to trade the QQQQ (NASDAQ 100 exchange traded fund). In recent days, trading out of my IRA has been challenging, since I can't short any stock in that account. Trying to find a long entry in a negative market can be a challenge.
So what I did was abandon some indicators and I started to look for lines of support and resistance instead. I would trade those for just one or two bars of profit, but my indicators are designed for swing trading, and catching a few profitable bars to trade is a different problem. I am comfortable doing this since my recollection of Gary B. Smith, formerly of TheStreet.com, is that his primary technique was to find resistance and support and/or patterns. Even when he was using patterns, I would argue it was to find resistance and support. Smith, who had a solid winning record, also used money management, but that's another story. So this approach has the backing of someone who knows what he is doing.
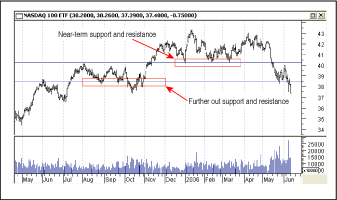
One of the hazards you face as the market continues to go down is that points of support must be found farther back in history (Figure 1). If this were just a little dip, then points of support and resistance are nearby and I would argue stronger in their influence. As the market continues to go down, however, using older points of support and resistance makes trading more of a crapshoot.

FIGURE 1: DAILY CHART OF QQQQ WITH SUPPORT AND RESISTANCE. The blue lines represent possible support levels. But the line you draw has to use points further back in time as the market turns from its past direction and goes in the opposite one, in this case from rising up to down.
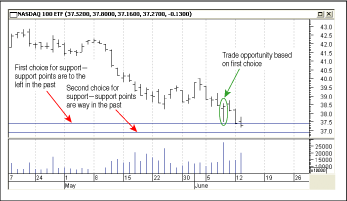
Why do I care? I am looking for points where I think the market will turn and put in limit bids to buy the support. I don't want a fill only to find the market going even lower. Take a look at Figure 2 and the two lines of support that have been drawn. If I had used the "first choice" as my real first choice for support, then on June 7, the day before the bar identified in green in Figure 2, I would have put in a limit bid to buy around 37.5. Selling at the close or putting a sell stop around 38.5 would have created a nice little profit on 2,000 shares.
As it turns out, my real first choice was the lower line since it had considerably more touches than the upper support line (see Figure 2). The moral of the story might be that near-term touches win out. In any event, using limit bids and sell-stops minimizes your exposure.

FIGURE 2: DAILY CHART OF QQQQ WITH SUPPORT CHOICES. Two levels of support are suggested using past pivot points. The bar with the green annotation is an example of where a limit bid near support would get filled and if you sell at the close, you would have a profit.
Return to September 2006 Contents
Originally published in the September 2006 issue of Technical Analysis
of STOCKS & COMMODITIES magazine. All rights reserved.
© Copyright 2006, Technical Analysis, Inc.