GO BACK
METASTOCK: Relative Spread Strength
Ian Copsey's article in this issue, "Relative Spread Strength," introduces
two variations on the relative strength index (RSI). The formula for these
indicators and the instructions for adding them to MetaStock follow.
To enter these indicators into MetaStock:
1. In the Tools menu, select "Indicator Builder."
2. Click New to open the Indicator Editor for a new indicator.
3. Type the name of the formula.
4. Click in the larger window and type in the formula.
5. Click OK to close the Indicator Editor.
Name: Rapid RSI
Formula:
tp:= 14; { time periods in RSI calculation}
plot:= C;
change:= ROC(plot,1,$);
Z:=Sum(If(change>0,change,0),tp);
Y:=Sum(If(change<0,Abs(change),0),tp);
Ytemp:=If(y=0,0.00001,y);
RS:=Z/Ytemp;
100-(100/(1+RS))
Name: Relative Spread Strength
Formula:
matp1:=10; {short MA time periods}
matp2:=40; {long MA time periods}
RStp:= 5; { time periods in RSI}
RSsmoothtp:=5; { time periods in smoothing of RSI}
plot:= Mov(C,matp1,E)-Mov(C,matp2,E);
change:= ROC(plot,1,$);
Z:=Sum(If(change>0,change,0),RStp);
Y:=Sum(If(change<0,Abs(change),0),RStp);
Ytemp:=If(y=0,0.00001,y);
RS:=Z/Ytemp;
Mov(100-(100/(1+RS)),RSsmoothtp,S)
--William Golson
MetaStock Support Representative
Equis International (A Reuters Company)
801 265-9998, www.metastock.com
GO BACK
WEALTH-LAB: Relative Spread Strength
The WealthScript code given here will draw both of the indicators (the
RSS and the RapidRSI) presented by Ian Copsey in his article, together
with RSS turning points and associated price peaks and troughs, in order
to facilitate divergence analysis (Figure 2).

FIGURE 2: WEALTH-LAB, RELATIVE SPREAD STRENGTH INDICATOR.
At each turning point on RSS, a red/green triangle is shown, both on the
RSS line and (some bars before) on the price chart.
In addition, we've added a simple trading system that seems to do
a nice job of trend-following the Dow Jones Industrial Average using weekly
bars (Figure 3).

FIGURE 3: WEALTH-LAB, RELATIVE SPREAD STRENGTH TRADING SYSTEM.
Here is a sample portfolio simulation on the 30 blue-chip stocks belonging
to the DJIA from 1970 to the present time, starting with $100,000 and using
one-tenth of equity for each position (profits reinvested, weekly data).
WealthScript code:
var RSSPane: integer = CreatePane( 100, false, false );
SetPaneMinMax( RSSPane, -15, 115 );
DrawRectangle( 0, 70, BarCount, 115, RSSPane, #GreenBkg, #Thin, #GreenBkg, true );
DrawRectangle( 0, -15, BarCount, 30, RSSPane, #RedBkg, #Thin, #RedBkg, true );
DrawHorzLine( 70, RSSPane, #Green, #Dotted );
DrawHorzLine( 30, RSSPane, #Red, #Dotted );
{$I 'RSS'}
var RSS1: integer = RSSSeries( #Close, 10, 40, 5, 5 );
PlotSeriesLabel( RSS1, RSSPane, #Red, #Thick, GetDescription( RSS1 ) );
{$I 'RapidRSI'}
var RapidRSI1: integer = RapidRSISeries( #Close, 14 );
PlotSeriesLabel( RapidRSI1, RSSPane, #Blue, #Thin, GetDescription( RapidRSI1 ) );
HideVolume;
var Bar, RSSPeakBar, RSSTroughBar, PricePeakBar, PriceTroughBar: integer;
var RSSPeak, RSSTrough: float;
for Bar := 50 to BarCount - 1 do
begin
  // show turning points on chart
  if TurnDown( Bar, RSS1 ) then
  begin
    RSSPeakBar := Bar - 1;
    RSSPeak := RSS( RSSPeakBar, #Close, 10, 40, 5, 5 );
    DrawImage('DownTriangleRed', RSSPane, RSSPeakBar, RSSPeak, false);
    // look back for corresponding peak in price
    PricePeakBar := HighestBar( RSSPeakBar, #High, 10 );
    DrawImage( 'DownTriangleRed', 0, PricePeakBar, PriceHigh( PricePeakBar ), false );
  end;
  if TurnUp( Bar, RSS1 ) then
  begin
    RSSTroughBar := Bar - 1;
    RSSTrough := RSS( RSSTroughBar, #Close, 10, 40, 5, 5 );
    DrawImage( 'UpTriangleGreen', RSSPane, RSSTroughBar, RSSTrough, true );
    // look back for corresponding trough in price
    PriceTroughBar := LowestBar( RSSTroughBar, #Low, 10 );
    DrawImage( 'UpTriangleGreen', 0, PriceTroughBar, PriceLow( PriceTroughBar ), true );
  end;
  if LastPositionActive then
  begin
    // Sell rule: both RSS and RapidRSI signaling OverBought
    if ( RSS( Bar, #Close, 10, 40, 5, 5 ) > 70 ) then
      if ( RapidRSI( Bar, #Close, 14 ) > 70 ) then
        SellAtMarket( Bar + 1, #All, '' );
  end
  else
  begin
    // Buy rule: both RSS and RapidRSI rising, but still not OverBought
    if ( RSS( Bar, #Close, 10, 40, 5, 5 ) < 70 ) then
      if ( RapidRSI( Bar, #Close, 14 ) < 70 ) then
        if ( Momentum( Bar, RSS1, 1 ) >= 0 ) then
          if ( Momentum( Bar, RapidRSI1, 1 ) >= 0 ) then
            BuyAtMarket( Bar + 1, '' );
  end;
end;
--Giorgio Beltrame
www.wealth-lab.com
GO BACK
AMIBROKER: Relative Spread Strength
In "Relative Spread Strength As A Long-Term Cyclic Tool," Ian
Copsey introduces two new indicators based on the classic relative strength
index (RSI): the relative spread strength (RSS) and the rapid RSI. Implementing
both indicators using AmiBroker Formula Language is easy and straightforward.
Listing 1 is for the RSS and Listing 2 shows the coding for the rapid RSI.
To use these indicators, open the Formula Editor in AmiBroker, enter the
code, and press the "Apply indicator" button. A sample chart is shown in
Figure 4.

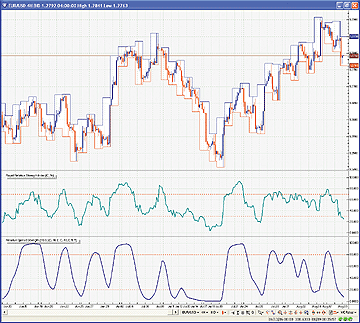
FIGURE 4: AMIBROKER, RELATIVE SPREAD STRENGTH INDICATOR.
This screenshot shows a weekly price chart of EUR/USD with a 14-week rapid
RSI in the middle pane and the relative spread strength in the bottom pane.
LISTING 1
// Relative Spread Strength
//
RSPeriod = Param("RSI Period", 5, 1, 100 );
E1Period = Param("E1 Period", 10, 1, 100 );
E2Period = Param("E2 Period", 40, 1, 200 );
E1 = MA( C, E1Period );
E2 = MA( C, E2Period );
Spread = E1 - E2;
RS = RSIa( Spread, RSPeriod );
Smooth = MA( RS, 5 );
Plot( Smooth, "RSS", colorRed );
LISTING 2
// Rapid RSI
//
Period = Param("Period", 14, 2, 100 );
Diff = C - Ref( C, -1 );
Up = Max( Diff, 0 );
Dn = Max( -Diff, 0 );
UpSum = Sum( Up, Period );
DnSum = Sum( Dn, Period );
RS = IIf( DnSum != 0, UpSum / DnSum, 100 );
RapidRSI = 100 - 100 / ( 1 + RS );
Plot( RapidRSI, "RapidRSI"+Period, colorRed );
--Tomasz Janeczko, AmiBroker.com
www.amibroker.com
GO BACK
NEUROSHELL TRADER: Relative Spread Strength
The relative spread strength indicator described by Ian Copsey in this
issue can be easily implemented in NeuroShell Trader by combining a few
of NeuroShell Trader's 800+ indicators. To implement the relative spread
strength (RSS), select "New Indicator ..." from the Insert menu and use the
Indicator Wizard to set up the following indicators:
Relative Spread Strength
     Simple Moving Average( RSI( Simple:Avg1-Avg2( Close, 10, 40 ), 5 ), 5 )
For more information on NeuroShell Trader, visit www.NeuroShell.com.
See sample in Figure 5.

FIGURE 5: NEUROSHELL, RELATIVE SPREAD STRENGTH INDICATOR.
Here is a sample NeuroShell chart demonstrating the RSS.
--Marge Sherald, Ward Systems Group, Inc.
301 662-7950, sales@wardsystems.com
www.neuroshell.com
GO BACK
eSIGNAL: Relative Spread Strength
In Ian Copsey's article in this issue, "Relative Spread Strength," we've
provided the following two formulas: Rss.efs and Rapid_Rsi.efs. Both studies
contain formula parameters that may be configured through the Edit Studies
option in the Advanced Chart for the period length and upper and lower
bands. Rss.efs also has parameters to adjust the RS length, and the length
for both moving averages. Sample implementations are shown in Figures 6
and 7.

FIGURE 6: eSIGNAL, RELATIVE SPREAD STRENGTH INDICATOR. Here
is a demonstration of the RSS in eSignal.

FIGURE 7: eSIGNAL, RELATIVE SPREAD STRENGTH INDICATOR. Here is a
demonstration of the rapid RSS in eSignal.
CODE FOR RSS:
/***************************************
Provided By : eSignal (c) Copyright 2006
Description: Relative Spread Strength
As A Long-Term Cyclic Tool
by Ian Copsey
Version 1.0 08/11/2006
Notes:
* Oct 2006 Issue of Stocks and Commodities Magazine
* Study requires version 8.0 or higher.
Formula Parameters:
Defaults:
RS Length
5
High Band
80
Low Band
20
Slow MA Length
40
Fast MA Length
10
***************************************/
function preMain() {
setStudyTitle("Relative Spread Strength ");
setCursorLabelName("RSS", 0);
setDefaultBarThickness(2, 0);
setDefaultBarFgColor(Color.red, 0);
var fp1 = new FunctionParameter("nRSLength", FunctionParameter.NUMBER);
fp1.setName("RS Length");
fp1.setLowerLimit(1);
fp1.setDefault(5);
var fp2 = new FunctionParameter("nHband", FunctionParameter.NUMBER);
fp2.setName("High Band");
fp2.setDefault(80);
var fp3 = new FunctionParameter("nLband", FunctionParameter.NUMBER);
fp3.setName("Low Band");
fp3.setDefault(20);
var fp4 = new FunctionParameter("nLenMA2", FunctionParameter.NUMBER);
fp4.setName("Slow MA Length");
fp4.setLowerLimit(1);
fp4.setDefault(40);
var fp5 = new FunctionParameter("nLenMA1", FunctionParameter.NUMBER);
fp5.setName("Fast MA Length");
fp5.setLowerLimit(1);
fp5.setDefault(10);
}
var bVersion = null;
var bInit = false;
var xSpread = null;
var xRSI = null;
var xRSS = null;
function main(nRSLength, nHband, nLband, nLenMA1, nLenMA2) {
if (bVersion == null) bVersion = verify();
if (bVersion == false) return;
if (bInit == false) {
addBand(nHband, PS_SOLID,
2, Color.blue, "High");
addBand(nLband, PS_SOLID,
2, Color.blue, "Low");
xSpread = efsInternal("calcSpread",
nLenMA1, nLenMA2);
xRSI = rsi(nRSLength, xSpread);
xRSS = sma(5, xRSI);
bInit = true;
}
return xRSS.getValue(0);
}
var xMA1 = null;
var xMA2 = null;
function calcSpread(nLen1, nLen2) {
if (xMA1 == null) xMA1 = ema(nLen1);
if (xMA2 == null) xMA2 = ema(nLen2);
var nE1 = xMA1.getValue(0);
var nE2 = xMA2.getValue(0);
if (nE1 == null || nE2 == null) return;
return (nE1 - nE2);
}
function verify() {
var b = false;
if (getBuildNumber() < 779) {
drawTextAbsolute(5, 35,
"This study requires version 8.0 or later.",
Color.white, Color.blue, Text.RELATIVETOBOTTOM|Text.RELATIVETOLEFT|Text.BOLD|Text.LEFT,
null, 13, "error");
drawTextAbsolute(5, 20,
"Click HERE to upgrade.@URL=https://www.esignal.com/download/default.asp",
Color.white, Color.blue, Text.RELATIVETOBOTTOM|Text.RELATIVETOLEFT|Text.BOLD|Text.LEFT,
null, 13, "upgrade");
return b;
} else {
b = true;
}
return b;
}
1
CODE FOR Rapid RSS:
/***************************************
Provided By : eSignal (c) Copyright 2006
Description: Relative Spread Strength
As A Long-Term Cyclic Tool
by Ian Copsey
Version 1.0 08/11/2006
Notes:
* Oct 2006 Issue of Stocks & Commodities Magazine
* Study requires version 8.0 or higher.
Formula Parameters:
Defaults:
Length
14
OverBought
70
OverSold
30
***************************************/
function preMain() {
setStudyTitle("Rapid RSI ");
setCursorLabelName("CRS", 0);
setDefaultBarThickness(2, 0);
setDefaultBarFgColor(Color.navy, 0);
var fp1 = new FunctionParameter("nLength", FunctionParameter.NUMBER);
fp1.setName("Length");
fp1.setLowerLimit(1);
fp1.setDefault(14);
var fp2 = new FunctionParameter("nOb", FunctionParameter.NUMBER);
fp2.setName("OverBought");
fp2.setDefault(70);
var fp3 = new FunctionParameter("nOs", FunctionParameter.NUMBER);
fp3.setName("OverSold");
fp3.setDefault(30);
}
var bVersion = null;
var bInit = false;
var xRapidRSI = null;
function main(nLength, nOb, nOs) {
if (bVersion == null) bVersion = verify();
if (bVersion == false) return;
if (bInit == false) {
addBand(nOb, PS_SOLID, 2,
Color.blue, "OB");
addBand(nOs, PS_SOLID, 2,
Color.blue, "OS");
xRapidRSI = efsInternal("calcRSS",
nLength);
bInit = true;
}
return xRapidRSI.getValue(0);
}
function calcRSS(nLen) {
var nCntr = 0;
var nUpSum = 0;
var nDnSum = 0;
var nRS = 0;
var nCRS = null;
for (nCntr = 0; nCntr < nLen; nCntr++) {
if (close(-nCntr) > close(-(nCntr+1))
) {
nUpSum += close(-nCntr) - close(-(nCntr+1));
}
if (close(-nCntr) < close(-(nCntr+1))
) {
nDnSum += close(-(nCntr+1)) - close(-nCntr);
}
}
if (nDnSum != 0) {
nRS = nUpSum / nDnSum;
} else {
nRS = 100;
}
if (getCurrentBarCount() > nLen && nUpSum
!= nDnSum) {
nCRS = 100 - 100 / (1 +
nRS);
} else {
nCRS = 0;
}
return nCRS;
}
function verify() {
var b = false;
if (getBuildNumber() < 779) {
drawTextAbsolute(5, 35,
"This study requires version 8.0 or later.",
Color.white, Color.blue, Text.RELATIVETOBOTTOM|Text.RELATIVETOLEFT|Text.BOLD|Text.LEFT,
null, 13, "error");
drawTextAbsolute(5, 20,
"Click HERE to upgrade.@URL=https://www.esignal.com/download/default.asp",
Color.white, Color.blue, Text.RELATIVETOBOTTOM|Text.RELATIVETOLEFT|Text.BOLD|Text.LEFT,
null, 13, "upgrade");
return b;
} else {
b = true;
}
return b;
}
To discuss these studies or download complete copies of the formulas,
please visit the EFS Library Discussion Board forum under the Bulletin
Boards link at www.esignalcentral.com. The eSignal formula scripts (EFS)
are also available for copying and pasting from the STOCKS & COMMODITIES
website at Traders.com.
--Jason Keck
eSignal, a division of Interactive Data Corp.
800 815-8256, www.esignalcentral.com
GO BACK
NEOTICKER: Relative Spread Strength
In "Relative Spread Strength As A Long-Term Cyclic Tool," Ian Copsey
presents two new indicators: the relative spread strength (RSS) and the
rapid RSI.
The relative spread strength indicator (Listing 1) is implemented in
NeoTicker formula language with three integer parameters: RSLength, Ema1,
and Ema2. Meanwhile, the rapid RSI (Listing 2) is implemented using Delphi
Script with three parameters: length, overbought, and oversold.
After installing the indicators in NeoTicker, they can be used in a
trading system like any other indicators in NeoTicker. As an example, a
stop-and-reverse system based on a crossover of overbought and oversold
levels can be built using NeoTicker BacktestEZ (Figure 8). This system
is based on a USD/JPY daily chart and with the rapid RSI.

FIGURE 8: NEOTICKER, RELATIVE SPREAD STRENGTH INDICATOR.
Ian Copsey's RSS and rapid RSI can be used in a trading system just as
with any other indicators in NeoTicker. Here is a sample stop-and-reverse
system based on a crossover of overbought and oversold levels. This system
is based on a USD/JPY daily chart using the rapid RSI.
A downloadable version of all indicators and example charts will
be available at the NeoTicker blog site (https://blog.neoticker.com).
LISTING 1
$E1 := qc_xaverage(data1, param2);
$E2 := qc_xaverage(data1, param3);
Spread := $E1-$E2;
myRS := rsindexmod(Spread, param1);
$Smooth := average(myRS, 5);
plot1 := $Smooth;
Plot2 := 80;
plot3 := 20;
LISTING 2
function tasc_rrsi : double;
var vprice : variant;
    i, upsum, downsum : integer;
    myRS, amount_diff : double;
begin
   if data1.barsnum [0] < param1.int  then
   begin
      itself.successall := false;
      exit;
   end;
   if not data1.valid [0] then
   begin
      itself.successex [1] := false;
      itself.plot[2] := param2.real;
      itself.plot[3] := param3.real;
      exit;
   end;
   data1.MakeValidArray(vprice, 'C', param1.int+1, true);
   upsum := 0;
   downsum := 0;
   for i := 0 to param1.int-1 do
   begin
      amount_diff := (vprice[i]-vprice[i+1]);
      if amount_diff < 0 then
         downsum := downsum+ntlib.abs(amount_diff)
      else
         upsum := upsum+amount_diff;
   end;
   if downsum <> 0 then
      myRS := upsum/downsum
   else
      myRS := 100;
   if upsum <> downsum then
      itself.plot[1] := 100 - 100/(1+myRS)
   else
      itself.plot[1] := 0;
   itself.plot[2] := param2.real;
   itself.plot[3] := param3.real;
end;
--Kenneth Yuen, TickQuest Inc.
www.tickquest.com
GO BACK
BIOCOMP DAKOTA: Relative Spread Strength
In his article in this issue, Ian Copsey demonstrates how to use the
relative spread strength (RSS) as a long-term cyclic tool. His RSS indicator
is a smoothed RSI of the difference between two moving averages.
In BioComp Dakota, you can easily recreate an adaptive form of the RSS
indicator by calling the built-in XMA, SMA, and RSI functions within the
ScriptBots API. Dakota's VB Script code to recreate the RSS is rather simple:
XMA1 = Dakota.XMA(PriceHistory,ParameterValue(1))
XMA2 = Dakota.XMA(PriceHistory,ParameterValue(2))
SpreadHistory(PriceCtr) = XMA1 - XMA2
RSHistory(PriceCtr) = Dakota.RSI(SpreadHistory,ParameterValue(3))
RSS = Dakota.SMA(RSHistory,5)
--Carl Cook
BioComp Systems, Inc., 952 746-5761
https://www.biocompsystems.com/products/Dakota/
GO BACK
AIQ: Relative Spread Strength
The AIQ code for Ian Copsey's relative spread strength (RSS) together
with the code for the rapid RSI will be available at our website. I devised
a simple trading system to test the RSS indicator:
1) Enter a long position when the indicator is less than
30
2) Exit the long position when the indicator is greater than
70 or five days
3) Enter a short position when the indicator is greater than
95
4) Exit the short position when the indicator is less than 30
or five days.
I used the NASDAQ 100 list of stocks to run the test from 10/11/2002
to 8/11/2006 on a daily end-of-day basis. Figure 9 shows the results of
the long and short-sale backtests. Initially, I tried the default parameters
for overbought and oversold of 70/30. The 30-level showed profitable results
but the 70-level for the short sales did not. In order to generate a profitable
set of trades on the short side, I had to increase the overbought level
to 95.

FIGURE 9: AIQ, RELATIVE SPREAD STRENGTH INDICATOR. Here
are the results of the long and short-sale backtests on the NASDAQ 100
from 10/11/2002 to 8/11/2006.
The code can be downloaded from the AIQ website at www.aiqsystems.com and
is also shown here for copying and pasting into the program.
--Richard Denning
AIQ Systems
richard.denning@earthlink.net
GO BACK
TECHNIFILTER PLUS: Relative Spread Strength
Here are the TechniFilter Plus formulas for the relative spread strength
(RSS) and the rapid RSI based on Ian Copsey's article in this issue, "Relative
Spread Strength As A Long-Term Cyclic Tool." See Figure 10 for a sample
chart.
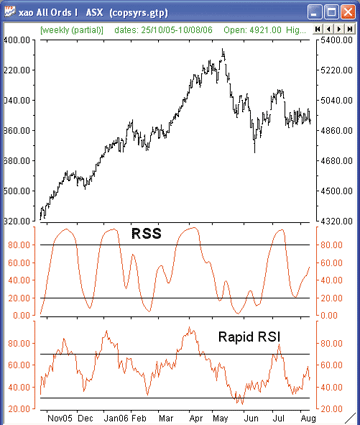
FIGURE 10: TECHNIFILTER, RELATIVE SPREAD STRENGTH INDICATOR.
Here is a sample chart of the RSS and rapid RSI indicators in TechniFilter.
NAME: RSS
SWITCHES: multiline
PARAMETERS: 5,10,40
FORMULA:
[1]: (CX&2-CX&3)G&1A&1 {c}{nRSS}{nc}  {rgb#255}
[2]: 80 {c} {n80} {rgb#0}
[3]: 20 {c} {n20} {rgb#0}
NAME: RapidRSI
SWITCHES: multiline
PARAMETERS: 14
FORMULA:
[1]: (C-CY1)U4F&1*100/(C-CY1)U0F&1 {c}{nRapidRSI}{nc}   {rgb#255}
[2]: 70 {c}   {rgb#0}
[3]: 30 {c}   {rgb#0}
Visit the home of Technifilter Plus at www.technifilter.com
to download these formulas and filter reports.
--Benzie Pikoos, Brightspark
+61 8 9375-1178, sales@technifilter.com
www.technifilter.com
GO BACK
ASPEN GRAPHICS: Relative Spread Strength
Ian Copsey's relative spread strength and the rapid RSI indicators are
easy to recreate and plot in Aspen Graphics. Two separate formulas must
be created: one for the RSS and one for the rapid RSI. The 70 and 30 lines
must also be plotted. The code for the indicators and the steps for plotting
the 70 and 30 lines are given here.
The number of periods for the moving averages and the length for the
RSI are configurable as study parameters. Right-click the rapid spread
strength study and select "Parameters..." to modify them.
RSS(Series, RSILength = 5, EMA1 = 10, EMA2 = 40) = begin
 E1 = savg($1.close, EMA1)
 E2 = savg($1.close, EMA2)
 spread = E1 - E2
 RS = RSI(Spread, RSILength)
 Smooth = savg(RS, 5)
 Smooth
end
Rapid RSI
RapidRSI(series, periods=14) = begin
 UpSum = 0
 DownSum = 0
 For Counter = 0 To Periods -1 begin
  if $1.close[Counter] > $1.close[Counter + 1] then
     UpSum = UpSum + $1.close[Counter] - $1.close[Counter + 1]
  if $1.close[Counter] < $1.close[Counter + 1] then
     DownSum = DownSum + $1.close[Counter + 1] - $1.close[Counter]
 end
 if DownSum != 0 then RS = UpSum / DownSum
 if DownSum == 100 then RS = 100
 if UpSum != DownSum then CRS = 100*UpSum / (UpSum + DownSum)
 if UpSum == DownSum then CRS = 50
 CRS
end
Plotting the 70 and 30 lines
To apply the 30% line, right-click the window that contains the indicator.
Left-click "Add overlay" to display the submenu. Move the cursor over "Formula
overlay." Move the cursor over "Level." Left-click on _30 to apply the
30 line. Repeat the process, selecting _70 during the last step to apply
the _70 line.
Sample charts for the RSS and rapid RSI are shown in Figures 11 and
12, respectively.
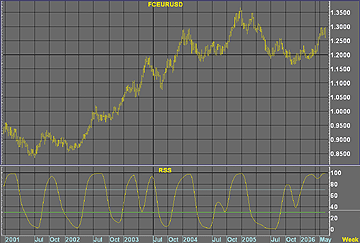
FIGURE 11: ASPEN GRAPHICS, RELATIVE SPREAD STRENGTH INDICATOR. Here
is the weekly euro/dollar on FXCM with the RSS plotted in the subgraph.
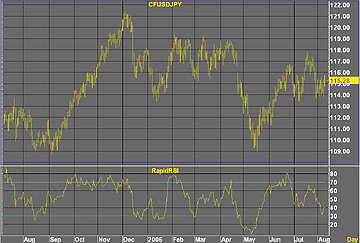
FIGURE 12: ASPEN GRAPHICS, RAPID RSI. Here is the daily dollar/yen spread
on COESfx with the rapid RSI plotted in the subgraph.
This code is also available from Aspen's FTP site at ftp://ftp.aspenres.com/Cust/TradersTips/
--Jeremiah Adams
Aspen Graphics Technical Support
support@aspenres.com
www.aspenres.com
GO BACK
FINANCIAL DATA CALCULATOR: Relative Spread
Strength
In "Relative Spread Strength As A Long-Term Cyclic Tool," Ian Copsey
uses the relative strength index (RSI) applied to the difference of two
moving averages as a timing tool for cycles. Two new indicators are introduced,
the rapid RSI and RSS (relative spread strength). The FDC code for the
corresponding macros is shown here.
To create the rapid RSI, open the macro wizard, choose "New macro,"
and enter the following code into the definition window:
ch: change #r
sumup :#l movsum (pos ch)
sumdn: abs #l movsum (neg ch)
d: sumup/sumdn
100*(1-1/1+d)
The syntax of use is: n rapidrsi close data, where n is the time
period and data is the dataset under consideration. The author recommends
n = 14, as in "14 rapidrsi close data."
To show the 70- and 30-percent lines on the graph, you would enter the
expression (n rapidrsi close data), 30 70. Of course, you could do
this to columns other than the close, or to several columns at once.
To create the rss, open the macro wizard, choose "New macro," and enter
the following code into the definition window:
lenrsi ma1 ma2: #l
data : #r
spread: (ma1 expave data) - (ma2 expave data)
lenrsi rsi spread
The syntax of use is: k n m rss close data, where k is the time
period for RSI, n is the length of the first exponential moving average,
m is the length of the second exponential moving average, and data is the
dataset under consideration.
For example, the author recommends 5 10 40 rss close data.
This macro gives you complete freedom to alter the time periods at will.
As with the previous macro, you could apply RSS to columns other than the
close, or to several columns at once.
Finally, if you substitute "movave" for "expave" in the code, you have
a version with simple moving averages instead of exponential moving averages.
--Bob Busby
856 857-9088, rbusby@mathinvestdecisions.com
Mathematical Investment Decisions, Inc.
www.mathinvestdecisions.com, www.financialdatacalculator.com
GO BACK
TRADECISION: Relative Spread Strength
The trading technique described in Ian Copsey's article, "Relative Spread
Strength As A Long-Term Cyclic Tool," helps forex traders to identify cycle
peaks.
Using the Function Builder in Tradecision, you need to create the rapid
RSI and RSS functions; then, using Indicator Builder, one can quickly write
the corresponding indicators and plot them on a price chart.
The code for Copsey's functions and indicators, which can help confirm
cycle highs and lows, is shown here but will also be available from our
website at www.tradecision.com.
RapidRSI Function
function (Price:Numeric = C, Length:Numeric = 14): Numeric;
var
Numerator := 0;
Dif := 0;
UpAmt := 0;
DownAmt := 0;
UpSum := 0;
DownSum := 0;
RapidRSI := 0;
end_var
if HistorySize < Length then return 0;
UpSum := 0;
DownSum := 0;
for Numerator:=0 to Length - 1 do
begin
DownAmt := 0;
UpAmt := 0;
Dif := Price\Numerator\ - Price\Numerator+1\;
if Dif > 0 then
UpAmt := Dif;
if Dif < 0 then
DownAmt := -Dif;
UpSum := UpSum + UpAmt;
DownSum := DownSum + DownAmt;
end;
if UpSum + DownSum <> 0 then
RapidRSI := 100 * UpSum / (UpSum + DownSum);
else
RapidRSI := 50;
return RapidRSI;
RSS Function
function (RSPeriod:Numeric = 5,
EMA1Period:Numeric = 10,
EMA2Period:Numeric = 40) :Numeric;
var
Spread := 0;
RS := 0;
end_var
Spread := SMA(Close, EMA1Period) - SMA(Close, EMA2Period);
RS := RapidRSI(Spread, RSPeriod);
return SMA(RS, 5);
Rapid RSI Indicator
return RapidRSI(C, 14);
RSS Indicator
return RSS(5, 10, 40);
While inserting indicators into a chart (the Insert Indicator dialog box),
don't forget to add the 30 and 70 thresholds.
To import these functions and indicators into Tradecision, visit the
area "Traders' Tips from Tasc Magazine" at https://tradecision.com/support/tasc_tips/tasc_traders_tips.htm.
A sample chart is shown in Figure 13.
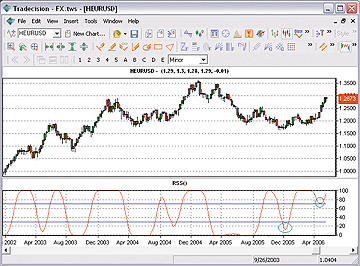
FIGURE 13: TRADECISION, RELATIVE SPREAD STRENGTH INDICATOR.
Looking at a weekly chart of EUR/USD with the RSS indicator inserted as
a subchart, we can see how the price levels correlated with the oversold
and overbought levels of the RSS indicator.
--Alex Grechanowski, Alyuda Research, Inc.
alex@alyuda.com, 347 416-6083
www.alyuda.com, www.tradecision.com
GO BACK
MCFX: Relative Spread Strength
In this issue, author Ian Copsey presents a forex-focused article named
"Relative Spread Strength." As access to foreign exchange trading has opened
up trading options for the retail trader, we have introduced a new charting
product called MCFX, specially designed for forex traders.
Mcfx's scripting language is fully compatible with EasyLanguage, which
means you can use the TradeStation code already given in the article's
sidebars. The result of applying both the rapid RSI and RSS indicators
to MCFX is demonstrated in Figure 14.
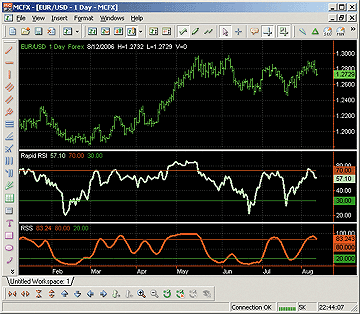
FIGURE 14: MCFX, RAPID RSI AND RSS. On this daily chart
of the euro versus the US dollar, you can see how the indicators fared.
To discuss this article or download a complete copy of the formulas, please
visit our discussion forum at forum.tssupport.com.
--Stanley Miller
TS Support, Llc
www.tssupport.com
GO BACK
ENSIGN SOFTWARE: Relative Spread Strength
The implementation of Ian Copsey's relative spread strength in Ensign
Windows does not require any extra programming code. Here are the steps
to recreate the relative spread strength indicator using the built-in studies:
1. Put on the moving average study object and set its parameters
to 10 and 40, with "Simple" as the formula selection.
2. Put on the relative strength study object and set its bars parameter
to 5. Change the datapoint selection to reference the moving average study
and its spread selection. Figure 15 shows the RSI property form.
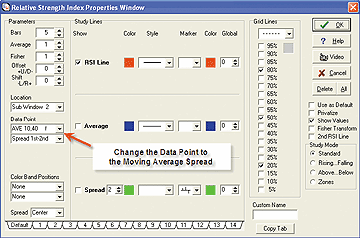
FIGURE 15: ENSIGN, RELATIVE SPREAD STRENGTH INDICATOR. Change the
properties of the RSI here.
The RSI study calculation is now on the moving average spread.
--Howard Arrington
Ensign Software
ensign2@ensignsoftware.com
www.ensignsoftware.com
GO BACK
VT TRADER: MODELING THE MARKET
Ian Copsey's article in this issue, "Relative Spread Strength As A Long-Term
Cyclic Tool," discusses the benefits of using the relative spread strength
indicator on long-term charts to identify major cycle highs and lows in
the underlying price. Copsey goes on to outline a trading methodology involving
the RSS and the rapid RSI (a variation of the standard RSI).
Copsey uses the RSS indicator on a weekly chart to get an indication
of the overall market direction and the rapid RSI on a daily chart to help
identify potential trading opportunities. When the weekly RSS begins to
show signs of being overbought or oversold, divergence between the daily
rapid RSI and price, the break of a trendline and/or support/resistance
levels, or confirmation of a reversal pattern can be used as trade signals.
We'll be offering both indicators for download in our user forums. The
VT Trader code and instructions for creating the indicators (input variables
are parameterized to allow customization) are also shown here:
Rapid RSI Indicator
1. Navigator Window>Tools>Indicator Builder>[New] button
2. In the Indicator Bookmark, type the following text for each field:
Name: TASC - 10/2006 - Rapid RSI
Short Name: vt_RapidRSI
Label Mask: Rapid Relative Strength Index (%prc%, %periods%)
Placement: New Frame
Inspect Alias: Rapid RSI
3. In the Input Bookmark, create the following variables:
[New] button... Name: Prc , Display Name: Price , Type: price , Default: Close
[New] button... Name: Periods , Display Name: Periods , Type: integer , Default: 14
4. In the Output Bookmark, create the following variables:
[New] button...
Var Name: CRS
Name: (CRS)
Line Color: dark green
Line Width: slightly thicker
Line Type: solid line
5. In the Horizontal Line Bookmark, create the following lines:
[New] button...
Value: +70.000
Color: red
Width: thin line
Type: dashed line
[New] button...
Value: +30.000
Color: red
Width: thin line
Type: dashed line
6. In the Formula Bookmark, copy and paste the following formula:
{Provided By: Visual Trading Systems, LLC Copyright (c) 2006}
{Description: Relative Spread Strength As A Long-Term Cyclic Tool by Ian Copsey}
{Notes: October 2006 Issue - Relative Spread Strength As A Long-Term Cyclic Tool}
{vt_RapidRSI Version 1.0}
dif:= prc - ref(prc,-1);
UpSum:= sum(if(dif>0,dif,0),periods);
DownSum:= sum(if(dif<0,abs(dif),0),periods);
RS:= UpSum/DownSum;
CRS:= 100-(100/(1+RS));
7. Click the "Save" icon to finish building the Rapid RSI indicator.
To attach the rapid RSI to a chart click the right mouse button
within the chart window and then select "Add Indicators" -> "TASC - 10/2006
- Rapid RSI" from the indicator list.
Relative Spread Strength (RSS) Indicator
1. Navigator Window>Tools>Indicator Builder>[New] button
2. In the Indicator Bookmark, type the following text for each field:
Name: TASC - 10/2006 - Relative Spread Strength (RSS)
Short Name: vt_RSS
Label Mask: Relative Spread Strength (RSS) (%prc1%, %MA1pr%,
             %MA1t%, %prc2%, %MA2pr%, %MA2t%, %rsiper%, %rssper%)
Placement: New Frame
Inspect Alias: Relative Spread Strength
3. In the Input Bookmark, create the following variables:
[New] button... Name: Prc1 , Display Name: MA1 Price , Type: price , Default: Close
[New] button... Name: MA1pr , Display Name: MA1 Periods , Type: integer , Default: 10
[New] button... Name: MA1t , Display Name: MA1 Type , Type: MA Type , Default: Exponential
[New] button... Name: Prc2 , Display Name: MA2 Price , Type: price , Default: Close
[New] button... Name: MA2pr , Display Name: MA2 Periods , Type: integer , Default: 40
[New] button... Name: MA2t , Display Name: MA2 Type , Type: MA Type , Default: Exponential
[New] button... Name: rsiper , Display Name: RSI Periods , Type: integer , Default: 5
[New] button... Name: rssper , Display Name: RSS Periods , Type: integer , Default: 5
4. In the Output Bookmark, create the following variables:
[New] button...
Var Name: RSS
Name: (RSS)
Line Color: dark blue
Line Width: slightly thicker
Line Type: solid line
5. In the Horizontal Line Bookmark, create the following lines:
[New] button...
Value: +80.000
Color: red
Width: thin line
Type: dashed line
[New] button...
Value: +20.000
Color: red
Width: thin line
Type: dashed line
6. In the Formula Bookmark, copy and paste the following formula:
{Provided By: Visual Trading Systems, LLC (c) Copyright 2006}
{Description: Relative Spread Strength As A Long-Term Cyclic Tool by Ian Copsey}
{Notes: TASC, October 2006 - Relative Spread Strength As A Long-Term Cyclic Tool}
{vt_RSS Version 1.0}
MA1:= mov(prc1,MA1pr,MA1t);
MA2:= mov(prc2,MA2pr,MA2t);
Spread:= MA1-MA2;
rsi_r:= (Spread - ref(Spread,-1));
rsi_rs := Wilders(if(rsi_r>0,rsi_r,0),rsiper) / Wilders(if(rsi_r<0,Abs(rsi_r),0),rsiper);
RS:= 100-(100/(1+rsi_rs));
RSS:= mov(RS,rssper,S);
7. Click the "Save" icon to finish building the Relative Spread Strength indicator.
To attach the RSS indicator to a chart, click the right mouse button
within the chart window and then select "Add Indicators" -> "TASC - 10/2006
- Relative Spread Strength (RSS)" from the indicator list.
![]() TRADESTATION:
Relative Spread Strength
TRADESTATION:
Relative Spread Strength
![]() METASTOCK:
Relative Spread Strength
METASTOCK:
Relative Spread Strength
![]() WEALTH-LAB:
Relative Spread Strength
WEALTH-LAB:
Relative Spread Strength
![]() AMIBROKER:
Relative Spread Strength
AMIBROKER:
Relative Spread Strength
![]() NEUROSHELL
TRADER: Relative Spread Strength
NEUROSHELL
TRADER: Relative Spread Strength
![]() eSIGNAL:
Relative Spread Strength
eSIGNAL:
Relative Spread Strength
![]() NEOTICKER:
Relative Spread Strength
NEOTICKER:
Relative Spread Strength
![]() BIOCOMP
DAKOTA: Relative Spread Strength
BIOCOMP
DAKOTA: Relative Spread Strength
![]() AIQ:
Relative Spread Strength
AIQ:
Relative Spread Strength
![]() TECHNIFILTER
PLUS: Relative Spread Strength
TECHNIFILTER
PLUS: Relative Spread Strength
![]() ASPEN
GRAPHICS: Relative Spread Strength
ASPEN
GRAPHICS: Relative Spread Strength
![]() FINANCIAL
DATA CALCULATOR: Relative Spread Strength
FINANCIAL
DATA CALCULATOR: Relative Spread Strength
![]() TRADECISION:
Relative Spread Strength
TRADECISION:
Relative Spread Strength
![]() MCFX:
Relative Spread Strength
MCFX:
Relative Spread Strength
![]() ENSIGN
SOFTWARE: Relative Spread Strength
ENSIGN
SOFTWARE: Relative Spread Strength
![]() VT
TRADER: Relative Spread Strength
VT
TRADER: Relative Spread Strength


