Maximize Growth, Minimize Risk
Entropic Analysis Of Equity Prices
by Ron McEwan
Here's a simple method that measures the disorder in equity price data.
Among the most significant (but perhaps least known to traders) technological breakthroughs of our lifetime were the ideas published in 1948 by Claude E. Shannon and Warren Weaver. Their ideas established the basic principles by which computers are capable of communicating with each other. For traders, the publication of the ideas established the mathematical framework applicable to the analysis and optimization of speculative endeavors. Further, it helped present the groundwork for another significant publication by J.L. Kelly Jr., whose concept was presented in the Bell System Technical Journal in 1956, "A New Interpretation Of Information Rate."
Many of you may be familiar with one of their ideas specifically applying to trading, the Kelly criterion (also referred to as the Kelly betting system). The Kelly criterion states that we should bet that fixed fraction of our stake, which maximizes growth. Another member of the Bell Labs team, Edward O. Thorp, went on to publish the well-known "beat the dealer" and "mathematics of gambling" concepts. Thorp could be referred to as the father of program trading. All this is based on the original ideas and concepts of applying entropy analysis to information as presented by Claude Shannon.
ABOUT ENTROPY
Entropy is the process whereby matter tends to decay into a constant uniform state of dispersion. Entropy goes in only one direction with respect to time. Here's an example: When you pour milk into your morning cup of coffee, first you see the milk, but soon it becomes dissolved uniformly throughout the coffee cup. This is entropy (also referred to as Brownian motion). Brownian motion may be familiar to those who have heard of or worked with the concept of a "random walk" or stochastic process.
This article is my attempt to provide a simple method for measuring such a stochastic process in equity price data. The analysis as applied in this spreadsheet is a stochastic model of equity prices as adapted from the work of John Conover. It is a method that traders with a long, short, or intraday time frame can use to exploit market dynamics. While the applications of entropy analysis to time series data is extensive in its applications, I wanted to apply a simple function to measure the probability of the continuation of an up or down movement for a security. (See sidebar, "Calculating the probability of an up/down move in a time series.")

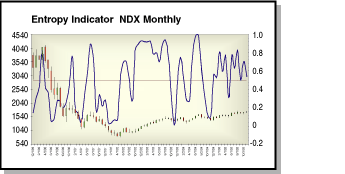
FIGURE 1: ENTROPY INDICATOR. On this monthly chart of the NDX, note where the ups and downs match up with price movements.
Excerpted from an article originally published in the November 2006
issue of Technical Analysis of STOCKS & COMMODITIES magazine. All rights
reserved. © Copyright 2006, Technical Analysis, Inc.
Return to November 2006 Contents