Access to foreign exchange trading has opened up exciting trading options for the retail trader. You can now trade alongside corporations and institutions in a highly liquid market that is global, traded around the clock, and highly leveraged. Before jumping into this market, however, we must understand the factors that affect the forex market. With that in mind, STOCKS& COMMODITIES has introduced Forex Focus to better prepare the retail trader to participate in the currency market.
By identifying advanced patterns in markets about to reverse, you can get a better idea when and where the next five-wave trend could emerge.
by Todd Gordon
A distinctive and recognizable pattern occurs in the early stages of an emerging trend. Being aware of such a pattern can help you position yourself for the pending move. This article will detail the characteristics of that pattern, the symmetrical price legs contained within it, what the price implications may be, and how a trader can identify and profit from this powerful pattern, referred to as the Gartley pattern. We will also delve into Elliott wave theory to further substantiate the symmetrical price swings that accompany Gartley patterns and their relative location to the market trend.
THE GARTLEY PATTERN
H.M. Gartley first introduced the pattern in 1937, but it wasn't until the late 1980s, when trader Larry Pesavento assigned expected ratios to the four legs of the pattern, that its use became more widespread.
Essentially, the Gartley pattern uncovers the market's tendencies to take advantage of the trend-following crowd. Unknown to the trend-followers, Gartleys frequently appear at critical reversal levels. They begin to take shape in the consolidation zones following an extended trend and will often bait latecoming trend-followers into the market, to their dismay.
The key to this pattern, which will also help us pinpoint our relative location within the current trend, is the symmetry of neighboring price swings. The symmetry of price swings has been observed and traded in the markets since the earliest days of technical analysis.

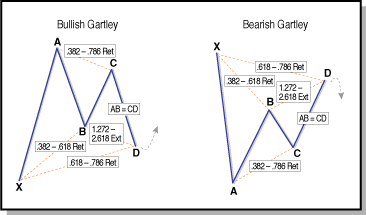
FIGURE 1: BULLISH AND BEARISH GARTLEY. Following the four legs and being aware of the corresponding Fibonacci ratios gives you an idea of where the trends correct.
FOLLOWING THE GARTLEY
First, let's explore the four legs and corresponding Fibonacci ratios of the Gartley pattern. Examine the bullish Gartley in Figure 1 on the left-hand side to understand how they unfold. As you go along, note the required Fibonacci ratios for each leg that make this pattern complete. After an extended downtrend, price explodes higher in leg X-A, labeled as short-covering in the longer-term downtrend by the trend-following crowd. To align themselves with the trend, they begin reshorting the market as leg A-B unfolds. Low-point B sends the market slightly higher in minor retracement leg B-C, which (in the minds of the bears) is a golden opportunity to pick up some cash before the market breaks to new lows.
As soon as the market has pulled all of the latecoming shorts into their positions, the real buyers who originally reversed the market at point X jump back into the pit to buy at point D. The saturation point of sellers at leg C-D is often the same distance as leg A-B, which creates the symmetrical support level for the bullish Gartley.
Return to Novemeber 2006 Contents
Originally published in the November 2006 issue of Technical Analysis
of STOCKS & COMMODITIES magazine. All rights reserved.
© Copyright 2006, Technical Analysis, Inc.