or return to November 2006 Contents
TRADESTATION: AUTOMATIC TRENDLINES
Giorgos Siligardos' article in this issue, "Building Automatic Trendlines," outlines an algorithmic trendline-drawing technique.
We have converted the three blocks of pseudo-code provided in the article into an EasyLanguage indicator and two functions. Each automatic trendline is based on a "percent retracement" threshold. The article suggests comparing 5%, 10%, 20%, 50%, and 80% retracements, which can be accomplished by inserting the indicator five times and appropriately converting the indicator amounts.
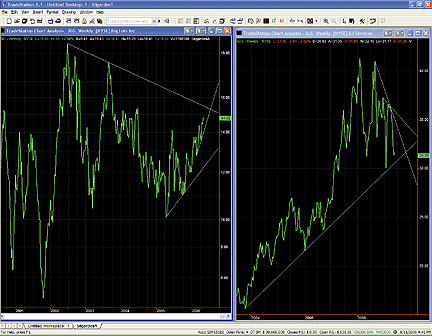
FIGURE 1: TRADESTATION, AUTOMATIC TRENDLINES. Here are sample weekly charts of Big Lots (BIG) and BJ Services (BJS) with automatic trendlines drawn using the Siligardos algorithm.The code for the indicator is shown here. A sample chart is shown in Figure 1. Code for the functions can be found in the EasyLanguage Library at TradeStation.com. To download the EasyLanguage indicator and function code for this article, search for the file "SiligardosAT.eld."
Indicator:  Siligardos Autotrend
inputs:
 Threshold( 30 ),
 Lookback( 300 ) ;
variables:
 TrendLineBuilt( false ),
 PivotsFound( 0 ),
 f( 0 ),
 b( 0 ),
 x( 0 ),
 y( 0 ),
 F1( 0 ),
 F2( 0 ),
 F3( 0 ),
 PF1( 0 ),
 PF2( 0 ),
 PF3( 0 ) ;
arrays:
 PivotArray[500]( 0 ),
 PivotType[4]( 0 ),
 PivotPosition[4]( 0 ),
 SI[500]( 0 ) ;
if LastBarOnChart then
 begin
 for x = 1 to Lookback
  begin
  PivotArray[x] = 0 ;
  end ;
 F1 =  1 ;
 F2 = F1 ;
 PF1 =  Close[F1] ;
 PF2 =  Close[F2] ;
 {find the first move greater than threshold percent}
 while ( 100 *AbsValue( PF1 - PF2 ) / MinList( PF1, PF2 )
  < Threshold and ( F2 < Lookback ) )
  begin
  F2 = F2 + 1 ;
  PF2 =  Close[F2] ;
  end ;
 F3 = F2 ;
 PF3 =  Close[F3] ;
 while F1 < Lookback
  begin
  while ( ( (100 * AbsValue( PF2 - PF3 )
   / MinList( PF2, PF3 ) < Threshold )
   or ( ( ( PF1 < PF2 ) and ( PF2 <= PF3 ) )
   or ( ( PF1>PF2) and ( PF2 >= PF3 ) ) ) )
   and ( F3 < Lookback ) )
   begin
   if ( ( ( PF1 < PF2 ) and ( PF2 <= PF3 ) )
     or ( ( PF1 > PF2 ) and ( PF2 >= PF3 ) ) )
   then
    begin
    F2 = F3 ;
    PF2 =  Close[F2] ;
    end ;
   F3 = F3 + 1 ;
   PF3 =  Close[F3] ;
   end ;
  if ( ( F3 = Lookback ) ) then
   begin
   F1 = F2 ;
   F2 = F3 ;
   PF1 =  Close[F1] ;
   PF2 =  Close[F2] ;
   end ;
  if ( F2 > F1 ) then
   begin
   PivotArray[F2] = 1 ;
   F1 = F2 ;
   F2 = F3 ;
   PF1 =  Close[F1] ;
   PF2 =  Close[F2] ;
   end ;
  end ;
 PivotArray[1] = 0 ;
 PivotArray[Lookback] = 0 ;
 end ;
if LastBarOnChart then
 begin
 x = 1 ;
 y = 1 ;
 while ( y < Lookback )
  begin
  y = y + 1 ;
  if ( ( PivotArray[ y ] <> 0 )
   or ( y = Lookback ) )
  then
   begin
   b = ( Close[y] - Close[x] ) / ( y - x ) ;
   for f = x to y
    begin
    SI[f] =  ( b * ( f - x ) + Close[x] ) ;
    end ;
   x = y ;
   end ;
  end ;
 F = 2 ;
 {locate pivots}
 PivotsFound = 0 ;
 while ( ( F < Lookback - 2 ) and ( PivotsFound < 4 ) )
  begin
  if ( ( SI[f] <= SI[ f + 1 ] )
   and ( SI[ f - 1 ] >= SI[f] ) )
  then
   begin
   PivotsFound = PivotsFound + 1 ;
   PivotType[ 5 - PivotsFound ] =  + 1 ;
   PivotPosition[ 5 - PivotsFound ] =  F ;
   end ;
  if ( ( SI[f] >= SI[ f + 1 ] )
   and (SI[ f - 1 ] <= SI[f] ) )
  then
   begin
   PivotsFound = PivotsFound + 1 ;
   PivotType[ 5 - PivotsFound ] =  - 1 ;
   PivotPosition[ 5 - PivotsFound ] =  f ;
   end ;
  F = F + 1 ;
  end ;
 if ( PivotsFound = 4 ) then
  begin
  if ( PivotType[2] = 1 )
   and ( PivotType[4] = 1 )
   and ( Close[ PivotPosition[2] ]
   < Close[ PivotPosition[4] ] )
   and ( MaxList( Close[ PivotPosition[2] ],
   Close[ PivotPosition[4] ] )
   < MaxList( High[ PivotPosition[4] ],Close[0] ) )
  then
   begin
   Value1 = TrendlineUp( Lookback,
    PivotPosition[2],PivotPosition[4] ) ;
   TrendlineBuilt = true ;
   end
  else if ( PivotType[2] = -1 )
   and ( PivotType[4] = -1 )
   and ( Close[ PivotPosition[2] ]
   > Close[ PivotPosition[4] ] )
   and ( MinList( Close[ PivotPosition[2] ],
   Close[ PivotPosition[4] ] ) > MinList
   ( Close[ PivotPosition[4] ], Close[0] ) )
  then
   begin
   Value1 = TrendlineDown( Lookback,
    PivotPosition[2], PivotPosition[4] );
   TrendlineBuilt = true ;
   end
  else
   Print( " Lookback trendline can be drawn,",
    "Threshold = ", Threshold ) ;
  end ;
 if ( PivotsFound >= 3 ) and TrendLineBuilt = false then
  begin
  if ( PivotType[1] = 1 )
   and ( PivotType[3] = 1 )
   and ( Close[ PivotPosition[1] ] <
   Close[ PivotPosition[3] ] )
   and ( MaxList( Close[ PivotPosition[1] ],
   Close[ PivotPosition[3] ] ) < MaxList(
   Close[ PivotPosition[3] ], Close[0] ) )
  then
   Value1 = TrendlineUp( Lookback,
   PivotPosition[1], PivotPosition[3] )
  else if ( PivotType[1] = -1 )
   and ( PivotType[3] = -1 )
   and ( Close[PivotPosition[1] ] >
   Close[ PivotPosition[3] ] )
   and ( MinList( Close[ PivotPosition[1] ],
   Close[ PivotPosition[3] ] ) > MinList(
   Close[ PivotPosition[3] ], Close[0] ) )
  then
   Value1 = TrendlineDown( Lookback,
   PivotPosition[1], PivotPosition[3] )
  else
   Print( "No trendline can be drawn,",
     "Threshold = ", Threshold ) ;
  end
 else
  Print( "No trendline can be drawn,",
    "Threshold = ", Threshold ) ;
 if ( PivotsFound < 3 ) then
  Print( "No Point Milestones Can Be Found,",
    "Threshold = ", Threshold ) ;
 end ;
--Mark MillsGO BACK
TradeStation Securities, Inc.
A subsidiary of TradeStation Group, Inc.
www.TradeStationWorld.com
eSIGNAL: AUTOMATIC TRENDLINES
For the article by Giorgos Siligardos in this issue, "Building Automatic Trendlines," we've provided the formula "AutomaticTrendlines.efs." The study contains several formula parameters that may be configured through the "Edit Studies" option in the Advanced Chart.
Several parameters allow for the customization of the swing indicator (SI) that the trendlines are based on, which are the first three parameters. The defaults for these parameters set the SI to the calculation described in the article with one exception: the percent change or percent retracement is based on the high or low of the bar for peaks and troughs, respectively.
We've also provided parameters to control the formatting for the SI lines and the automatic trendlines, as well as the colors for the most current peak or trough that is developing but that is not yet confirmed. There are also two parameters that enable labels for the swings and a label for the current percent retracement value, which are both "off" by default. There are two parameters that can be used to limit the number of drawn swinglines and trendlines. The parameter for the trendlines sets the limit of 10 by default, which means 10 trendlines based on peaks and 10 additional trendlines based on the troughs. Finally, there is a parameter for turning off the display of the trendlines.
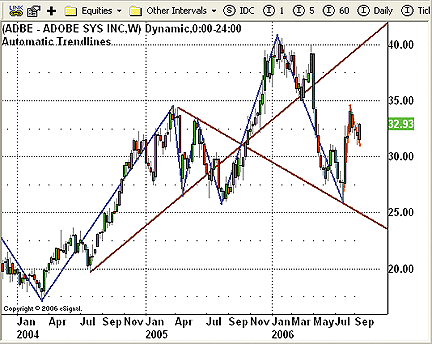
FIGURE 2: eSIGNAL, AUTOMATIC TRENDLINES. Here is a demonstration of automatic trendlines in eSignal.
To discuss these studies or download complete copies of the formulas,
please visit the EFS Library Discussion Board forum under the Bulletin
Boards link at www.esignalcentral.com. The eSignal formula scripts (EFS)
are also available for copying and pasting from below.
GO BACK/*************************************** Provided By : eSignal (c) Copyright 2006 Description: Building Automatic Trendlines by Giorgos E. Siligardos, PhD Version 1.0 08/31/2006 Notes: * Nov 2006 Issue of Stocks and Commodities Magazine * SI indicator is modified from EFS Library formula: RealTimeSwings.efs (https://kb.esignalcentral.com/article.asp?article=1450&p=4) Formula Parameters: Default: * Swing: # of Bars 0 This is the minimum number of bars required to define a swing point. This number is for both sides of the swing point (i.e. 5 bars on the left and right of the swing bar). * Swing: Wave Type % Change in Price (% Retracement, % Change in Price) * Swing: Wave Percentage 20 The number 5 will be treated as 5.0%. The number 0.05 will be treated as 0.0005%. * Line Thickness 2 * Confirmed Swing Line Color Blue * Developing Swing Line Color Red * Display Swing Labels False * Display % Retracement Label False * Number of Historical Labels 100 * Number of Historical Trend Lines 10 * Display Trend Lines True * Trend Line Thickness 2 * Trend Line Color Maroon Notes: 1.1 3/24/2004 * Added labels to display point value, % retracement, number of bars and price level of swings. The number of historical labels is set to 100 for performance reasons. Increase this number to view more historical labels. * Added labels to display current swing's % retracement. Description of Swing Labels: At Swing Highs - Points (% Retracement) Price (Number of Bars) At Swing Lows - Price (Number of Bars) Points (% Retracement) *****************************************************************/ function preMain() { setPriceStudy(true); setStudyTitle("Automatic Trendlines "); setShowCursorLabel(false); setShowTitleParameters(false); var fp1 = new FunctionParameter("nNum", FunctionParameter.NUMBER); fp1.setName("Swing: # of Bars"); fp1.setLowerLimit(0); fp1.setDefault(0); var fp2a = new FunctionParameter("sWaveType", FunctionParameter.STRING); fp2a.setName("Swing: Wave Type"); fp2a.addOption("% Retracement"); fp2a.addOption("% Change in Price"); fp2a.setDefault("% Change in Price"); var fp2 = new FunctionParameter("nRet", FunctionParameter.NUMBER); fp2.setName("Swing: Wave Percentage"); fp2.setLowerLimit(0); fp2.setDefault(20); var fp5 = new FunctionParameter("nThickness", FunctionParameter.NUMBER); fp5.setName("Line Thickness"); fp5.setLowerLimit(1); fp5.setDefault(2); var fp6 = new FunctionParameter("cColor1", FunctionParameter.COLOR); fp6.setName("Confirmed Swing Line Color"); fp6.setDefault(Color.blue); var fp7 = new FunctionParameter("cColor2", FunctionParameter.COLOR); fp7.setName("Developing Swing Line Color"); fp7.setDefault(Color.red); var fp8 = new FunctionParameter("bSwingLabels", FunctionParameter.STRING); fp8.setName("Display Swing Labels"); fp8.addOption("True"); fp8.addOption("False"); fp8.setDefault("False"); var fp9 = new FunctionParameter("bRetLabel", FunctionParameter.STRING); fp9.setName("Display \% Retracement Label"); fp9.addOption("True"); fp9.addOption("False"); fp9.setDefault("False"); var fp10 = new FunctionParameter("nNumLabels", FunctionParameter.NUMBER); fp10.setName("Number of Historical Labels"); fp10.setLowerLimit(1); fp10.setDefault(100); var fp11 = new FunctionParameter("nNumATL", FunctionParameter.NUMBER); fp11.setName("Number of Historical Trend Lines"); fp11.setLowerLimit(1); fp11.setDefault(10); var fp12 = new FunctionParameter("bTrendLines", FunctionParameter.STRING); fp12.setName("Display Trend Lines"); fp12.addOption("True"); fp12.addOption("False"); fp12.setDefault("True"); var fp13 = new FunctionParameter("nTLThickness", FunctionParameter.NUMBER); fp13.setName("Trend Line Thickness"); fp13.setLowerLimit(1); fp13.setDefault(2); var fp14 = new FunctionParameter("cTLColor", FunctionParameter.COLOR); fp14.setName("Trend Line Color"); fp14.setDefault(Color.maroon); } var bEdit = true; // tracks change of user inputs var cntr = 0; // image counter for swing lines var bInit = false; // initialization routine completion var nNumBars = null; // number of bars for defining swings var sWaveTypeG = null; // wave type for confirming swings var nRetpcnt = null; // percent retracement for defining swings var nThicknessG = null; // line thickness var cColorcon = null; // confirmed swing color var cColordev1 = null; // developing swing color var sHSource = null; // price source for high swings var sLSource = null; // price source for low swings var x1a = null; // x-coordinate for point a of developing line 1 var x1b = null; // x-coordinate for point b of developing line 1 var x2a = null; // x-coordinate for point a of developing line 2 var x2b = null; // x-coordinate for point b of developing line 2 var y1a = null; // y-coordinate for point a of developing line 1 var y1b = null; // y-coordinate for point b of developing line 1 var y2a = null; // y-coordinate for point a of developing line 2 var y2b = null; // y-coordinate for point b of developing line 2 var vLastSwing = null; // tracking swing type of last confirmed swing var nScntr = 0; // bar counter for swing confirmation var nLcntr = 0; // label counter for swing labels var aSwingsIndex = new Array(6); // tracks current swings indexes for last 5 swings var aSwingsPrice = new Array(6); // tracks current swing prices for last 5 swings var nNumLabelsG = null; // max number of swing labels var bSwingLabelsG = null; // controls swing labels display var vSpace = null; // spacer for Labels // Automatic Trendline variables var nTcntr = 0; // counter for trendline TagIDs. var bDrawn = false; // flag for tracking the most recently drawn ATL var aSwingsType = new Array(6); // 1 = peak, -1 = trough var nNumATLG = null; // global var for ATL limit. var bTrendLinesG = null; // global var for Trend Line display var nTLThicknessG = null; // global var for Trend Line thickness var cTLColorG = null; // global var for Trend Line color function main(nNum, sWaveType, nRet, nThickness, cColor1, cColor2, bSwingLabels, bRetLabel, nNumLabels, nNumATL, bTrendLines, nTLThickness, cTLColor) { var nState = getBarState(); var nIndex = getCurrentBarIndex(); var h = high(0); var l = low(0); var c = close(0); var i = 0; // record keeping if (nState == BARSTATE_NEWBAR) { if (cntr > 500) cntr = 0; // limits number of swing lines to 500. if (x1a != null) x1a -= 1; if (x1b != null) x1b -= 1; if (x2a != null) x2a -= 1; if (x2b != null) x2b -= 1; i = 0; for (i = 0; i < 6; ++i) { if (aSwingsIndex[i] != null) aSwingsIndex[i] -= 1; } } //Initialization if (bEdit == true) { if (nNumBars == null) nNumBars = nNum; if (sWaveTypeG == null) sWaveTypeG = sWaveType; if (nRetpcnt == null) nRetpcnt = nRet/100; if (nThicknessG == null) nThicknessG = nThickness; if (cColorcon == null) cColorcon = cColor1; if (cColordev1 == null) cColordev1 = cColor2; if (sHSource == null) sHSource = "High"; if (sLSource == null) sLSource = "Low"; if (x1a == null) x1a = 0; if (y1a == null) y1a = c; if (nNumLabelsG == null) nNumLabelsG = nNumLabels; if (bSwingLabelsG == null) bSwingLabelsG = bSwingLabels; if (nNumATLG == null) nNumATLG = nNumATL; if (bTrendLinesG == null) bTrendLinesG = bTrendLines; if (nTLThicknessG == null) nTLThicknessG = nTLThickness; if (cTLColorG == null) cTLColorG = cTLColor; nLcntr = nNumLabels; // Initialize vSpace var OM = (close(0) * 0.005); //offset multiplier var sInterval = getInterval(); if (sInterval == "D") OM = OM*3; if (sInterval == "W") OM = OM*20; if (sInterval == "M") OM = OM*30; var TimeFrame = parseInt(sInterval); if (TimeFrame >= 1 && TimeFrame <= 5) { OM = OM*(TimeFrame/15); } else if (TimeFrame > 5 && TimeFrame <= 15) { OM = OM*(TimeFrame/10); }else if (TimeFrame > 15) { OM = OM*(TimeFrame/5); } if (!isNaN(TimeFrame)) OM = (OM/TimeFrame)*3; vSpace = OM; bEdit = false; } if (bInit == false) { bInit = Init(h,l,c); } // Swings if (nState == BARSTATE_NEWBAR) { nScntr += 1; // confirmed Swings if (nScntr > nNumBars) { confirmSwings(); if (bInit == true) { doLine("dev1"); doLine("dev2"); } } } checkSwings(h, l); if (bInit == true) { doLine("dev1"); doLine("dev2"); } // % Retracement Label var nWaveRet = (Math.abs(y2a-y2b) / Math.abs(y1b-y1a))*100; if (x1b == x2b) nWaveRet = 0.0; if (bRetLabel == "True") { var sWaveRetText = " \%Retraced: " + nWaveRet.toFixed(2) + " "; drawTextRelative(2, y2b, sWaveRetText, cColordev1, null, Text.BOLD|Text.LEFT|Text.VCENTER|Text.FRAME, "Arial", 10, "Ret"); } // Automatic Trendlines (ATL) if (nState == BARSTATE_NEWBAR && bDrawn == false) autoTL(); return; } /****** Functions *****/ /***********************/ function Init(h,l,c) { if (close(-(nNumBars*2)) == null) { return false; } else { // Find initial line. // The initial line will be the first high or low swing, // which has the greater difference of the swing point to // the close of the first bar. var Index = getCurrentBarIndex() var hIndex = Index; var lIndex = Index; var j = nNumBars*2; if (j == 0) j = 1; var aHigh = getValue(sHSource, 0, -j); var aLow = getValue(sLSource, 0, -j); var vHH = aHigh[0]; var vLL = aLow[0]; var tempIndex = Index; var i = 0; for (i = 0; i < j; ++i) { if (aHigh[i] > vHH) { vHH = aHigh[i]; hIndex = tempIndex; } if (aLow[i] < vLL) { vLL = aLow[i]; lIndex = tempIndex; } tempIndex -= 1; } if (vHH - y1a > y1a - vLL) { vLastSwing = "L"; x1b = hIndex - Index; y1b = vHH; doLine("dev1"); x2a = x1b; y2a = vHH; x2b = 0; y2b = c; doLine("dev2"); } else { vLastSwing = "H"; x1b = lIndex - Index; y1b = vLL; doLine("dev1"); x2a = x1b; y2a = vLL; x2b = 0; y2b = c; doLine("dev2"); } } if (vLastSwing != null) { return true; } else { return false; } } function doLine(sType) { //confirmed if (sType == "con") { cntr += 1; nTcntr += 1; bDrawn = false; // reset ATL drawing if (nTcntr > nNumATLG) nTcntr = 1; drawLineRelative(x1a, y1a, x1b, y1b, PS_SOLID, nThicknessG, cColorcon, sType+cntr); //Swing Labels if (bSwingLabelsG == "True") doSwingLabels(sType); x1a = x2a; y1a = y2a; x1b = x2b; y1b = y2b; x2a = x1b; y2a = y1b; aSwingsIndex.pop(); aSwingsIndex.unshift(x1b); aSwingsPrice.pop(); aSwingsPrice.unshift(y1b); if (vLastSwing == "H") { y2b = getValue(sHSource); aSwingsType.pop(); aSwingsType.unshift(1); // record type of swing for ATL } if (vLastSwing == "L") { y2b = getValue(sLSource); aSwingsType.pop(); aSwingsType.unshift(-1); // record type of swing for ATL } } // dev1 if (sType == "dev1") { drawLineRelative(x1a, y1a, x1b, y1b, PS_SOLID, nThicknessG, cColordev1, sType); aSwingsIndex[0] = x1b; aSwingsPrice[0] = y1b; //Swing Labels if (bSwingLabelsG == "True") doSwingLabels(sType); } // dev2 if (sType == "dev2") { if (x2a != 0 && x2a != x2b) { if ( (vLastSwing == "H" && sHSource == "Close") || (vLastSwing == "L" && sLSource == "Close") ) { x2b = 0; y2b = close(); } drawLineRelative(x2a, y2a, x2b, y2b, PS_SOLID, nThicknessG, cColordev1, sType); } else { removeLine(sType); } } return; } function doSwingLabels(sType) { var sTagNamePts = "SwingPtsDev"; var sTagNameRet = "SwingRetDev"; var sTagNamePr = "SwingPrDev"; var sTagNameBars = "SwingBarsDev"; var nWaveRet = ((Math.abs(aSwingsPrice[1]-aSwingsPrice[0]) / Math.abs(aSwingsPrice[1]-aSwingsPrice[2])) * 100); var nBars = (aSwingsIndex[0] - aSwingsIndex[1]); if (sType == "con") { //nWaveRet = (Math.abs(y2a-y2b) / Math.abs(y1b-y1a)); nLcntr += 1; if (nLcntr > nNumLabelsG) nLcntr = 1; sTagNamePts = "SwingPts"+sType+nLcntr; sTagNameRet = "SwingRet"+sType+nLcntr; sTagNamePr = "SwingPr"+sType+nLcntr; sTagNameBars = "SwingBars"+sType+nLcntr; } var pts = (y1b-y1a).toFixed(2); if (y1a < y1b) { // swing high drawTextRelative(x1b, y1b+vSpace, pts + " ", eval("cColor"+sType), null, Text.BOTTOM|Text.RIGHT, "Arial", 10, sTagNamePts); // Points if (!isNaN(nWaveRet)) { drawTextRelative(x1b, y1b+vSpace, "| ("+nWaveRet.toFixed(2)+"\%)", eval("cColor"+sType), null, Text.BOTTOM|Text.LEFT, "Arial", 10, sTagNameRet); // % Retracement } drawTextRelative(x1b, y1b+vSpace, y1b.toFixed(2) + " ", eval("cColor"+sType), null, Text.TOP|Text.RIGHT, "Arial", 10, sTagNamePr); // Price if (!isNaN(nBars)) { drawTextRelative(x1b, y1b+vSpace, "| ("+nBars+" Bars)", eval("cColor"+sType), null, Text.TOP|Text.LEFT, "Arial", 10, sTagNameBars); // Number of Bars } } else { // swing low drawTextRelative(x1b, y1b-vSpace, pts + " ", eval("cColor"+sType), null, Text.TOP|Text.RIGHT, "Arial", 10, sTagNamePts); // Points if (!isNaN(nWaveRet)) { drawTextRelative(x1b, y1b-vSpace, "| ("+nWaveRet.toFixed(2)+"\%)", eval("cColor"+sType), null, Text.TOP|Text.LEFT, "Arial", 10, sTagNameRet); // % Retracement } drawTextRelative(x1b, y1b-vSpace, y1b.toFixed(2) + " ", eval("cColor"+sType), null, Text.BOTTOM|Text.RIGHT, "Arial", 10, sTagNamePr); // Price if (!isNaN(nBars)) { drawTextRelative(x1b, y1b-vSpace, "| ("+nBars+" Bars)", eval("cColor"+sType), null, Text.BOTTOM|Text.LEFT, "Arial", 10, sTagNameBars); // Number of Bars } } return; } function confirmSwings() { if (x1b != x2b) { // underdeveloped dev1 line if (sWaveTypeG == "% Retracement") { var nWave = (Math.abs(y2a-y2b) / Math.abs(y1b-y1a)); } else { var nWave = (Math.abs(y2a-y2b) / y1b); } if (vLastSwing == "L" && nWave >= nRetpcnt ) { // Swing High nScntr = 0; vLastSwing = "H"; doLine("con"); } else if (vLastSwing == "H" && nWave >= nRetpcnt ) { // Swing Low nScntr = 0; vLastSwing = "L"; doLine("con"); } } return; } function checkSwings(h, l) { // dev1 if (vLastSwing == "L") { // find Swing High if (h >= y1b) { // higher high, no swing nScntr = 0; x1b = 0; y1b = h; doLine("dev1"); x2a = 0; y2a = h; } } else if (vLastSwing == "H") { // find Swing Low if (l <= y1b) { // Lower low, no swing nScntr = 0; x1b = 0; y1b = l; doLine("dev1"); x2a = 0; y2a = l; } } // dev2 if (nScntr == 0) { x2b = 0; if (vLastSwing == "H") y2b = h; if (vLastSwing == "L") y2b = l; } else { if (vLastSwing == "H" && h >= y2b) { y2b = h; x2b = 0; } else if (vLastSwing == "L" && l <= y2b) { y2b = l; x2b = 0; } } return; } function autoTL() { // draw Automatic Trendlines if (bTrendLinesG == "False" || getBarState() != BARSTATE_NEWBAR) return; if (aSwingsIndex[4] == null) return; // not enough confirmed swings yet var bCond = false; // condition flag var nATLx1 = 0; // x-coordinate for start of ray var nATLx2 = 0; // x-coordinate for second point of ray var nATLy1 = null; // y-coordinate for start of ray var nATLy2 = null; // y-coordinate for second point of ray var sATL_ID = "ATL" + nTcntr; // tagID for ATL var nIndex = getCurrentBarIndex(); var P1 = aSwingsType[5]; var P2 = aSwingsType[4]; var P3 = aSwingsType[3]; var P4 = aSwingsType[2]; // Condition 1 if (P4 == 1 && P2 == 1 && aSwingsPrice[4] < aSwingsPrice[2]) { if (atlHigh(aSwingsIndex[4], aSwingsIndex[2]) < high(0)) { nATLx1 = aSwingsIndex[4]; nATLx2 = aSwingsIndex[2]; nATLy1 = aSwingsPrice[4]; nATLy2 = aSwingsPrice[2]; sATL_ID += "_h"; bCond = true; } } // Condition 2 if (bCond == false) { if (P4 == -1 && P2 == -1 && aSwingsPrice[4] > aSwingsPrice[2]) { if (atlLow(aSwingsIndex[4], aSwingsIndex[2]) > low(0)) { nATLx1 = aSwingsIndex[4]; nATLx2 = aSwingsIndex[2]; nATLy1 = aSwingsPrice[4]; nATLy2 = aSwingsPrice[2]; sATL_ID += "_l"; bCond = true; } } } // Condition 3 if (bCond == false) { if (P3 == 1 && P1 == 1 && aSwingsPrice[5] < aSwingsPrice[3]) { if (atlHigh(aSwingsIndex[5], aSwingsIndex[3]) < atlHigh(aSwingsIndex[3], 0)) { nATLx1 = aSwingsIndex[5]; nATLx2 = aSwingsIndex[3]; nATLy1 = aSwingsPrice[5]; nATLy2 = aSwingsPrice[3]; sATL_ID += "_h"; bCond = true; } } } // Condition 4 if (bCond == false) { if (P3 == -1 && P1 == -1 && aSwingsPrice[5] > aSwingsPrice[3]) { if (atlLow(aSwingsIndex[5], aSwingsIndex[3]) > atlLow(aSwingsIndex[3], 0)) { nATLx1 = aSwingsIndex[5]; nATLx2 = aSwingsIndex[3]; nATLy1 = aSwingsPrice[5]; nATLy2 = aSwingsPrice[3]; sATL_ID += "_l"; bCond = true; } } } // draw trend line if (nATLy1 != null && nATLy2 != null && bCond == true) { drawRay(nATLx1, nATLy1, nATLx2, nATLy2, sATL_ID); bDrawn = true; } return; } function atlHigh(x1, x2) { // returns highest high between bar indexes x1 and x2 // where x2 is most recent index. var nH = high(x1); for (var i = x1; i <= x2; i++) { nH = Math.max(nH, high(i)); } return nH; } function atlLow(x1, x2) { // returns Lowest low between bar indexes x1 and x2 // where x2 is most recent index. var nL = low(x1); for (var i = x1; i <= x2; i++) { nL = Math.min(nL, low(i)); } return nL; } function getSlope(x1, y1, x2, y2) { return (y2 - y1) / (x2 - x1); } function drawRay(x1, y1, x2, y2, sID) { var x1_ray = x1; var y1_ray = y1; var nSlope = getSlope(x1, y1, x2, y2); // draw ray from bar with greatest slope factor between swings. var j = x1; var nEnd = x2; if (nSlope > 0) { // up trend for(j; j <= nEnd; j++) { var nTempSlope = getSlope(j, low(j), x2, y2); if (nTempSlope > nSlope) { nSlope = nTempSlope; x1_ray = j; y1_ray = low(j); } } } else if (nSlope < 0) { // down trend for(j; j <= nEnd; j++) { var nTempSlope = getSlope(j, high(j), x2, y2); if (nTempSlope < nSlope) { nSlope = nTempSlope; x1_ray = j; y1_ray = high(j); } } } var nSlopeAdj = nSlope * 500; y2 += nSlopeAdj; x2 += 500; drawLineRelative(x1_ray, y1_ray, x2, y2, PS_SOLID, nTLThicknessG, cTLColorG, sID); return; }
--Jason Keck
eSignal, a division of Interactive Data Corp.
800 815-8256, www.esignalcentral.com
WEALTH-LAB: ACTIVE TRENDLINES
After implementing Giorgos Siligardos' "active trendlines" method in
WealthScript, we also came up with two nice enhancements that could be
useful when dealing with divergence analysis:
1. Trendlines can be built and drawn over any price series, even over indicators: therefore, a "Series" argument was added, along with a "Pane" parameter for plotting.2. By adding a "Bar" parameter also, we are able to plot past trendlines as well (Figure 3).
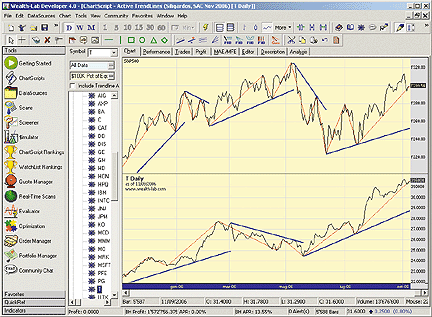
FIGURE 3: WEALTH-LAB, SIMULTANEOUS HISTORY OF ACTIVE TRENDLINES ON MULTIPLE SERIES. Here, we have T (AT&T Inc.) plotted against the S&P 500 index, both showing their swing indicator (in red) and some recent history of their trendlines (in blue).
WealthScript code:
{$I 'PTBar'}
function UpwardTrendLine(Bar, Series: integer; var Bar1, Bar3: integer): boolean;
begin // adjust Bar1 and Bar3 such that a proper upward trendline can be drawn
  var b: integer;
  // if an intermediate bar crosses the line (Bar1,Bar3), advance Bar1
  for b := Bar1 + 1 to Bar3 - 1 do
    if @Series[b] < LineExtendY(Bar1, @Series[Bar1], Bar3, @Series[Bar3], b) then Bar1 := b;
  // if a subsequent bar crosses the [right-extended] line (Bar1,Bar2), advance Bar3
  for b := Bar3 + 1 to Bar do
    if @Series[b] < LineExtendY(Bar1, @Series[Bar1], Bar3, @Series[Bar3], b) then Bar3 := b;
  // require higher highs and higher lows
  if (Bar3 < Bar) and (@Series[Bar1] < @Series[Bar3]) then
    Result := (Highest(Bar3, Series, Bar3 - Bar1 + 1) < Highest(Bar, Series, Bar - Bar3 + 1));
end;
function DownwardTrendLine(Bar, Series: integer; var Bar1, Bar3: integer): boolean;
begin // adjust Bar1 and Bar3 such that a proper downward trendline can be drawn
  var b: integer;
  // if an intermediate bar crosses the line (Bar1,Bar3), advance Bar1
  for b := Bar1 + 1 to Bar3 - 1 do
    if @Series[b] > LineExtendY(Bar1, @Series[Bar1], Bar3, @Series[Bar3], b) then Bar1 := b;
  // if a subsequent bar crosses the [right-extended] line (Bar1,Bar2), advance Bar3
  for b := Bar3 + 1 to Bar do
    if @Series[b] > LineExtendY(Bar1, @Series[Bar1], Bar3, @Series[Bar3], b) then Bar3 := b;
  // require lower highs and lower lows
  if (Bar3 < Bar) and (@Series[Bar1] > @Series[Bar3]) then
    Result := (Lowest(Bar3, Series, Bar3 - Bar1 + 1) > Lowest(Bar, Series, Bar - Bar3 + 1));
end;
// starting back at any past Bar, draw an "Active TrendLine" on its most recent peaks/troughs
function DrawActiveTrendLine(Bar, Series: integer; Threshold: float;
                             LogScale: boolean; Pane, Color, Style: integer): integer;
begin
  var PTBs: integer = PTBarSeries(Series, Threshold);
  try
    var Bar3: integer = trunc(@PTBs[Bar]);
    var Bar2: integer = trunc(@PTBs[Bar3]);
    var Bar1: integer = trunc(@PTBs[Bar2]);
    if @Series[Bar3] < @Series[Bar2] then begin // build an upward trendline between troughs
      if not UpwardTrendLine(Bar, Series, Bar1, Bar3) then begin
        Bar3 := Bar2; Bar1 := trunc(@PTBs[Bar1]); // build a downward trendline between peaks
        if not DownwardTrendLine(Bar, Series, Bar1, Bar3) then exit;
      end;
    end else // build a downward trendline between peaks
      if not DownwardTrendLine(Bar, Series, Bar1, Bar3) then begin
        Bar3 := Bar2; Bar1 := trunc(@PTBs[Bar1]); // build an upward trendline between troughs
        if not UpwardTrendLine(Bar, Series, Bar1, Bar3) then exit;
      end;
    var y: float;
    if not LogScale then y := (@Series[Bar3] - @Series[Bar1]) * (Bar - Bar1) / (Bar3 - Bar1)
              else y := Exp(Ln(@Series[Bar3] / @Series[Bar1]) * (Bar - Bar1) / (Bar3 - Bar1));
    DrawLine(Bar1, @Series[Bar1], Bar, @Series[Bar1] + y, Pane, Color, Style);
    Result := Bar1;
  except
  end;
end;
HideVolume;
var SP500: integer = GetExternalSeries('^GSPC', #Close);
var IndexPane: integer = CreatePane(250, true, true);
var Bar: integer;
PlotSeries(SISeries(#Close, 3.3), 0, #Red, #Thin);
Bar := BarCount - 1;
while (Bar > 0) do Bar := DrawActiveTrendLine(Bar, #Close, 3.3, false, 0, #Blue, #Thick);
PlotSeries(#Close, 0, #Black, #Thin);
PlotSeries(SISeries(SP500, 1.8), IndexPane, #Red, #Thin);
Bar := BarCount - 1;
while (Bar > 0) do Bar := DrawActiveTrendLine(Bar, SP500, 1.8, false, IndexPane, #Blue, #Thick);
PlotSeriesLabel(SP500, IndexPane, #Black, #Thin, 'S&P500');
GO BACK
--Giorgio Beltrame
www.wealth-lab.com
AMIBROKER: AUTOMATIC TRENDLINES
In "Building Automatic Trendlines," Giorgos Siligardos presents a technique of drawing automatic trendlines based on algorithmically detected pivot points. We presented a similar technique back in 2000 in our newsletter at https://www.amibroker.com/newsletter/04-2000.html.
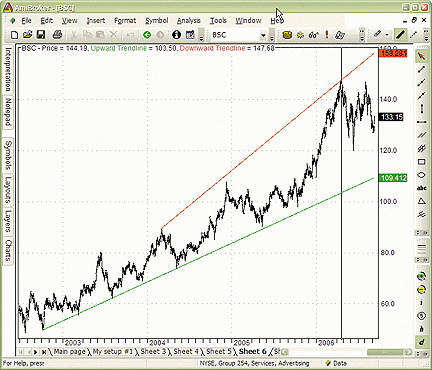
Instead of using very complex code such as that presented in the Siligardos article, we used AmiBroker's built-in peak and trough detection functions. For this Traders' Tips contribution, we decided to improve our original formula to use three pivots per trendline instead of the original two. Of course, the formula can be further expanded to use more pivots, but for simplicity and compactness of the code, we present the three-pivot version, which still yields good results, as shown in Figure 4.
FIGURE 4: AMIBROKER, AUTOMATIC TRENDLINE. Here is a daily price chart of BSC with algorithmically generated trendlines (the percent-change parameter is set to 13.2%).
GO BACKLISTING 1 Plot( Close, "Price", colorBlack, styleBar ); // trend-line connecting troughs x = Cum(1); perchg = Param("Pct. change", 13, 0.1, 30, 0.1 ); startvalue = SelectedValue( Trough( Low, perchg, 1 ) ); EndValue2 = SelectedValue( Trough( Low, perchg, 2 ) ); endvalue1 = SelectedValue( Trough( Low, perchg, 3 ) ); startbar = SelectedValue( ValueWhen( Low == startvalue, x, 1 ) ); endbar = SelectedValue( ValueWhen( Low == endvalue1, x, 1 ) ); // draw trend line only if troughs go in one direction if( sign( EndValue1 - EndValue2 ) == sign( EndValue2 - StartValue ) ) { Aa = (endvalue1-startvalue)/(endbar-startbar); b = startvalue; trendline = Aa * ( x - startbar ) + b; Plot( IIf( x >= endbar, trendline, Null ), "Upward T-line", colorGreen ); } // trend-line connecting peaks startvalue = SelectedValue( Peak( High, perchg, 1 ) ); EndValue2 = SelectedValue( Peak( High, perchg, 2 ) ); endvalue1 = SelectedValue( Peak( High, perchg, 3 ) ); startbar = SelectedValue( ValueWhen( High == startvalue, x, 1 ) ); endbar = SelectedValue( ValueWhen( High == endvalue1, x, 1 ) ); // draw trend line only if peaks go in one direction if( sign( EndValue1 - EndValue2 ) == sign( EndValue2 - StartValue ) ) { Aa = (endvalue1-startvalue)/(endbar-startbar); b = startvalue; trendline = Aa * ( x - startbar ) + b; Plot( IIf( x >= endbar, trendline, Null ), "Downward T-line", colorRed );}
--Tomasz Janeczko, AmiBroker.com
www.amibroker.com
NEUROSHELL TRADER: AUTOMATIC TRENDLINES
The automatic trendline indicator described by Giorgos Siligardos in his article in this issue can be easily implemented in NeuroShell Trader using NeuroShell Trader's ability to call external libraries. External libraries can be written in C, C++, Power Basic, IBasic Pro, or Delphi.
After moving the Pascal pseudo-code given in the article to your preferred
compiler and creating an external library, you can insert the resulting
automatic trendline indicator as follows:
1. Select "New Indicator ..." from the Insert menu.
2. Choose the External Program & Library Calls category.
3. Select the appropriate External Call indicator.
4. Setup the parameters to match your compiled library.
5. Select the Finished button.
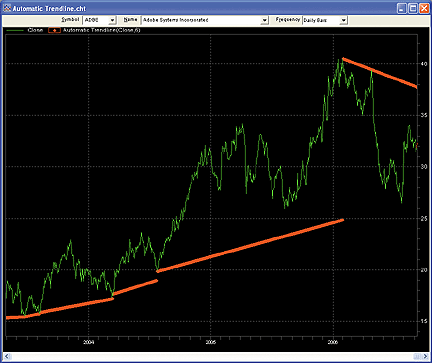
FIGURE 5: NEUROSHELL, AUTOMATIC TRENDLINE. Here is a sample NeuroShell Trader chart that shows the automatic trendline indicator.If you decide to use the automatic trendline indicator in a prediction or a trading strategy, the parameters can be optimized by the Genetic Algorithm built into NeuroShell Trader Professional.
Users of NeuroShell Trader can go to the STOCKS & COMMODITIES section
of the NeuroShell Trader free technical support website to download a copy
of this or any past Traders' Tips.
--Marge Sherald, Ward Systems Group, Inc.GO BACK
301 662-7950, sales@wardsystems.com
www.neuroshell.com
NeoTicker: AUTOMATIC TRENDLINES
The automatic trendline indicator presented in the article "Building Automatic Trendlines" by Giorgos Siligardos can be implemented in NeoTicker as a Delphi script indicator.
First, create an indicator called "tasc_autotrendline" with four parameters: swing type (percent or point); swing value; trendline color; and trendline width. This indicator will draw a single trendline on the chart using the last four swing points and last closing price of the data series.
The code is shown below. Readers can also download a version of the
indicator from the NeoTicker blog site.
LISTING 1
function tasc_autotrendline : double;
var pdiff_up, pdiff_down, pdiff : real;
    push_swing, type_percent, use_confirm, is_temp, draw_trend : boolean;
    curr_pos, dist_pos, target_pos, new_line, temp_pos, samebar,
    current_line_id, trend_dir, d_from, d_to, i, j : integer;
    P1b, P2b, P3b, P4b : integer;
    s, u : string;
const
  PHeapSize        = 15;
  Param_Color      = 0;
  Param_Width      = 1;
  Param_ZigType    = 2;
  Param_Diff       = 3;
  RT_LineID        = 4;
  RT_LastBar       = 5;
  RT_LineOnLastBar = 6;
  RT_LastWasTemp   = 7;
  Line_Direction   = 8;
  Line_OldSwingPt  = 9;
  Line_PrevSwingPt = 10;
  Line_CurrSwingPt = 11;
  Line_TempSwingPt = 12;
  Swing_Counter    = 13;
  PivotHeapSize    = 100;
  PriceNu   = 0;
  PriceUp   = 1;
  PriceDown = -1;
begin
   if not data1.valid [0] then
   begin
      itself.successall := false;
      exit;
   end;
   if pheap.size = 0 then
   begin
      pheap.allocate (PHeapSize);
      pheap.fill (0, PHeapSize-1, 0);
      pheap.value [Param_Color] := Params.items ['Trend-line Color'].color;
      pheap.value [Param_Width] := params.items ['Trend-line Width'].int;
      s := params.items ['Swing Type'].str;
      u := uppercase (s);
      if u = 'PERCENT' then
      pheap.value [Param_ZigType] := 1;
      pheap.value [Param_Diff] := params.items ['Swing Value'].real;
      pheap.value [RT_LineID] := -1;
      pHeap.value [Line_Direction]   := PriceNu;
      pHeap.value [Line_OldSwingPt]  := data1.Barsnum [0];
      pHeap.value [Line_PrevSwingPt] := data1.Barsnum [0];
      pHeap.value [Line_CurrSwingPt] := data1.Barsnum [0];
      pHeap.value [Line_TempSwingPt] := data1.Barsnum [0];
      pHeap.value [Swing_Counter] := 0;
      drawingobjects.deleteall;
      // Store swing index pivot point bars number and price
      pHeap.allocateintlist ('pivotbar', pivotHeapSize);
      pHeap.allocateintlist ('pivotdirection', pivotHeapSize);
   end;
   // determine direction of move
   new_line := 0;
   push_swing := false;
   is_temp := false;
   curr_pos := data1.barsnum [0] - round (pHeap.value [Line_PrevSwingPt]);
   dist_pos := data1.barsnum [0] - round (pHeap.value [Line_CurrSwingPt]);
   temp_pos := data1.barsnum [0] - round (pheap.value [Line_TempSwingPt]);
   pdiff := pheap.value [Param_Diff];
   samebar := (tq_round (pheap.value [RT_LastBar]) = itself.currentbar [0]);
   if pheap.value [Param_ZigType] = 1 then // is percent type
   begin
      pdiff_up := (Data1.High [0] - data1.low [dist_pos]) / data1.low [dist_pos] * 100;
      pdiff_down := (Data1.Low [0] - data1.high [dist_pos]) / data1.high [dist_pos] * 100;
   end
   else
   begin
      pdiff_up := Data1.High [0] - data1.low [dist_pos];
      pdiff_down := Data1.Low [0] - data1.high [dist_pos];
   end;
   // find new line direction
   if pHeap.value [Line_Direction] = PriceNu then
   begin
      // find first move direction
      if pdiff_up >= pdiff then
      begin
        pheap.listpush('pivotbar', data1.barsnum [0]);
        pheap.listpush('pivotdirection', 1);
        pheap.inc(Swing_Counter);
        new_line := 1;
        push_swing := true;
      end
      else if (- pdiff_down) >= pdiff then
      begin
        pheap.listpush('pivotbar', data1.barsnum [0]);
        pheap.listpush('pivotdirection', -1);
        pheap.inc(Swing_Counter);
        new_line := -1;
        push_swing := true;
      end;
   end
   else if pHeap.value [Line_Direction] = PriceUp then
   begin
      if (dist_pos > 0) and ((- pdiff_down) >= pdiff) then // check if turn around
      begin
        pheap.listpush('pivotbar', data1.barsnum [0]);
        pheap.listpush('pivotdirection', -1);
        pheap.inc(Swing_Counter);
        new_line := -1;
        push_swing := true;
      end
      else // check if continuation
      begin
         if data1.high [dist_pos] < data1.high [0] then // further the move
         begin
            pheap.intlist ['pivotbar', 0] := data1.barsnum [0];
            new_line := 1;
            pheap.value [Line_CurrSwingPt] := data1.barsnum [0];
            pheap.value [Line_TempSwingPt] := data1.barsnum [0];
         end
         else if samebar and (dist_pos = 0) then // update real-time changes
         begin
            new_line := 1;
         end
         else if data1.islastbar and (dist_pos > 0) then
         begin
            if dist_pos = 1 then
            begin
              is_temp := true;
              new_line := -1;
              pheap.value [Line_TempSwingPt] := data1.barsnum [0];
            end
            else if data1.low [temp_pos] > data1.low [0] then
            begin
              is_temp := true;
              new_line := -1;
              pheap.value [Line_TempSwingPt] := data1.barsnum [0];
            end
            else if samebar and (temp_pos = 0) then
            begin
               is_temp := true;
               new_line := -1;
            end;
         end;
      end;
   end
   else if pHeap.value [Line_Direction] = PriceDown then
   begin
      if (dist_pos > 0) and (pdiff_up > pdiff) then // check if turn around
      begin
        pheap.listpush('pivotbar', data1.barsnum [0]);
        pheap.listpush('pivotdirection', 1);
        pheap.inc(Swing_Counter);
        new_line := 1;
        push_swing := true;
      end
      else // check if continuation
      begin
         if data1.low [dist_pos] > data1.low [0] then // further the move
         begin
            pheap.intlist ['pivotbar', 0] := data1.barsnum [0];
            new_line := -1;
            pheap.value [Line_CurrSwingPt] := data1.barsnum [0];
            pheap.value [Line_TempSwingPt] := data1.barsnum [0];
         end
         else if samebar and (dist_pos = 0) then // update real-time changes
         begin
            new_line := -1;
         end
         else if data1.islastbar and (dist_pos > 0) then
         begin
            if dist_pos = 1 then
            begin
              is_temp := true;
              new_line := 1;
              pheap.value [Line_TempSwingPt] := data1.barsnum [0];
            end
            else if data1.high [temp_pos] < data1.high [0] then
            begin
              is_temp := true;
              new_line := 1;
              pheap.value [Line_TempSwingPt] := data1.barsnum [0];
            end
            else if samebar and (temp_pos = 0) then
            begin
              is_temp := true;
              new_line := 1;
            end;
         end;
      end;
   end;
   if new_line <> 0 then // ready to draw
   begin
      if pheap.value [RT_LastWasTemp] <> 0 then
      begin
         pheap.value [RT_LineOnLastBar] := 0;
         pheap.value [RT_LastWasTemp] := 0;
      end;
      if push_swing then
      begin
         pheap.value [line_oldswingpt] := pheap.value [line_prevswingpt];
         pheap.value [line_prevswingpt] := pheap.value [line_currswingpt];
         pheap.value [line_currswingpt] := data1.barsnum [0];
         pheap.value [line_tempswingpt] := data1.barsnum [0];
      end;
      pheap.value [RT_LineOnLastBar] := itself.currentbar [0];
      if is_temp then
      begin
         pheap.value [RT_LastWasTemp] := 1;
      end
      else
      begin
         pheap.value [RT_LastWasTemp] := 0;
         pheap.value [line_direction] := new_line;
      end;
   end;
   if pheap.value [Line_Direction] > 0 then
   begin
      i := data1.barsnum [0] - round (pheap.intlist ['pivotbar', 0]);
      itself.plot [1] := data1.high [i];
      itself.plot [2] := i;
      itself.plot [3] := pheap.intlist ['pivotdirection', 0];
   end
   else if pheap.value [Line_Direction] < 0 then
   begin
      i := data1.barsnum [0] - round (pheap.intlist ['pivotbar', 0]);
      itself.plot [1] := data1.low [i];
      itself.plot [2] := i;
      itself.plot [3] := pheap.intlist ['pivotdirection' ,0];
   end
   else
      itself.successall := false;
   // determine which CONDITION SET is met
   if data1.islastbar and (pheap.value [Swing_Counter] >= 4) then
   begin
      trend_dir := 0;
      P4b := data1.barsnum [0] - ntlib.trunc(pheap.intlist ['pivotbar', 0]);
      P3b := data1.barsnum [0] - ntlib.trunc(pheap.intlist ['pivotbar', 1]);
      P2b := data1.barsnum [0] - ntlib.trunc(pheap.intlist ['pivotbar', 2]);
      P1b := data1.barsnum [0] - ntlib.trunc(pheap.intlist ['pivotbar', 3]);
      if (pheap.intlist ['pivotdirection', 0] > 0) and
         (pheap.intlist ['pivotdirection', 2] > 0) and
         (data1.high [P2b] < data1.high [P4b]) and
         (ntlib.max(data1.high [P4b],data1.high [P2b]) <
          ntlib.max(data1.high [P4b],data1.close [0])) then
      begin
         ntlib.debug ('CON 1');
         trend_dir := 1;
         d_from := P2b;
         d_to := P4b;
      end
      else if (pheap.intlist ['pivotdirection', 0] < 0) and
              (pheap.intlist ['pivotdirection', 2] < 0) and
              (data1.low [P2b] > data1.low [P4b]) and
              (ntlib.min(data1.low [P2b],data1.low [P4b]) >
               ntlib.min(data1.low [P4b],data1.close [0])) then
      begin
         ntlib.debug ('CON 2');
         trend_dir := -1;
         d_from := P2b;
         d_to := P4b;
      end
      else if (pheap.intlist ['pivotdirection', 1] > 0) and
              (pheap.intlist ['pivotdirection', 3] > 0) and
              (data1.high [P1b] < data1.high [P3b]) and
              (ntlib.max(data1.high [P1b],data1.high [P3b]) <
               ntlib.max(data1.high [P3b],data1.close [0])) then
      begin
         ntlib.debug ('CON 3');
         trend_dir := 1;
         d_from := P1b;
         d_to := P3b;
      end
      else if (pheap.intlist ['pivotdirection', 1] < 0) and
              (pheap.intlist ['pivotdirection', 3] < 0) and
              (data1.low [P1b] > data1.low [P3b]) and
              (ntlib.min(data1.low [P1b],data1.low [P3b]) <
               ntlib.min(data1.low [P3b],data1.close [0])) then
      begin
         ntlib.debug ('CON 4');
         trend_dir := -1;
         d_from := P1b;
         d_to := P3b;
      end;
      if (ntlib.trunc(pheap.value [RT_LineID]) < 0) then
      begin
         if (pHeap.value [Param_Width] <> 0) then
         begin
            current_line_id := drawingobjects.add (cotTrendLine);
            drawingobjects.autoremoveonupdatebytick [current_line_id] := false;
            drawingobjects.color [current_line_id] :=
                                  ntlib.trunc(pHeap.value[Param_Color]);
            drawingobjects.penwidth [current_line_id] :=
                                  ntlib.trunc(pHeap.value[Param_Width]);
            pHeap.value [RT_LineID] := current_line_id;
         end;
      end
      else
         current_line_id := ntlib.trunc(pHeap.value [RT_LineID]);
      if (current_line_id >= 0) and ((d_from-d_to) > 0) then
         with drawingobjects do
         begin
            if trend_dir > 0 then
            begin
               setpoint (current_line_id, 0,
                         data1.datetime [d_from], data1.high [d_from]);
               setpoint (current_line_id, 1,
                         data1.datetime [d_to], data1.high [d_to]);
            end
            else
            begin
               setpoint (current_line_id, 0,
                         data1.datetime [d_from], data1.low [d_from]);
               setpoint (current_line_id, 1,
                         data1.datetime [d_to], data1.low [d_to]);
            end;
         end;
   end;
end;
GO BACK--Kenneth Yuen, TickQuest Inc.
www.tickquest.com
AIQ: AUTOMATIC TRENDLINES
The AIQ code for a portion of Giorgos Siligardos' method for drawing automatic trendlines is given here.
The first part of the code finds pivot points based on the number of bars surrounding the pivot point. The number of bars on either side of a high pivot that have lower highs than the pivot define the strength of a high pivot. Similarly, the number of bars on either side of a low pivot that have higher lows than the pivot define the strength of a low pivot. Changing the variable called "strength" in our pivot code sets this strength parameter.
To illustrate how these pivots can be used in a trading system, I created a divergence trading system, which is also included in the code, where I used the pivots to establish a divergence between the price and the MACD oscillator. A crossover on the %K-%D stochastic indicator is used to trigger the entries.
Figure 6 shows the summary results of testing the long and short side
of the system on the NASDAQ 100 list of stocks. The long side outperformed
the NASDAQ 100 index during the recent bullish period from 9/12/2002 to
9/12/2006 but racked up large losses during the bearish period from 9/12/2000
to 9/12/2002. The short side outperformed the NASDAQ 100 index during the
bearish period but showed flat performance during the bullish period.
MACD Divergence Test Results
 Direction Long Short  Long Short
 From  Sept. 13, 2000 Sept. 13, 2002
 To  Sept. 12, 2002 Sept. 12, 2006
 No. of trades  209 191 391 629
 Avg. per trade  -1.63% 1.16% 1.29% 0.11%
 Annualized return  -103.44% 79.8% 37.43% 6.7%
 Reward/risk  0.63 1.63 1.64 1.07
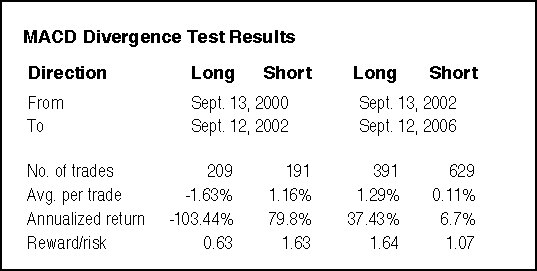
FIGURE 6: AIQ, DIVERGENCE TRADING SYSTEM. Here is a summary of test results for NASDAQ 100 stocks with an MACD divergence system using pivot points to determine the divergence over one bullish and one bearish period.
Before trading this system on stocks, it appears that a market-timing
filter should be added and additional test runs performed including a portfolio
simulation.
This AIQ code can be downloaded from the AIQ website at www.aiqsystems.com
or copied and pasted from the STOCKS & COMMODITIES website at Traders.com.
!! PIVOTS-FIVE LOW AND FIVE HIGH
! Coded by: Richard Denning 9/12/06
!COMMON SETUP INFORMATION
 Define    periods  252. !Total look back period
 Define    strength  12. !Number of bars on each side of pivot
 OTD   is Offsettodate(Month(),Day(),Year()).
 LowR   is LoVal([low],(2*strength)+1).
 LowM  is Val([low],strength).
 LS   if  LowR = LowM.
 HighR  is HiVal([high],(2*strength)+1).
 HighM   is Val([high],strength).
 HS   if  HighR = HighM.
!FIND FIRST PIVOT LOW
      LT1   is scanany(LS,periods) then OTD .
       LO1   is ^LT1 + Strength.
     LO1dte   is SetDate(LO1).
 LowLO1   is val([low],^LO1).

!FIND SECOND PIVOT LOW THAT IS BEFORE THE FIRST PIVOT LOW
 LT2   is scanany(LS,periods,LO1) then OTD.
 LO2   is ^LT2 + Strength.
      LO2dte   is SetDate(LO2).
     LowLO2   is val([low],^LO2).

!FIND THIRD PIVOT LOW THAT IS BEFORE THE SECOND PIVOT LOW
 LT3   is scanany(LS,periods,LO2) then OTD.
 LO3   is ^LT3 + Strength.
 LO3dte   is SetDate(LO3).
 LowLO3   is val([low],^LO3).

!FIND FORTH PIVOT LOW THAT IS BEFORE THE THIRD PIVOT LOW
 LT4   is scanany(LS,periods,LO3) then OTD.
 LO4   is ^LT4 + Strength.
 LO4dte   is SetDate(LO4).
 LowLO4  is val([low],^LO4).

!FIND FIFTH PIVOT LOW THAT IS BEFORE THE FORTH PIVOT LOW
 LT5   is scanany(LS,periods,LO4) then OTD.
 LO5   is ^LT5 + Strength.
 LO5dte   is SetDate(LO5).
 LowLO5  is val([low],^LO5).
!__________________________________________________________
!FIND FIRST PIVOT HIGH
      HT1  is scanany(HS,periods,0) then OTD .
       HO1  is ^HT1 + Strength.
 HO1dte   is SetDate(HO1).
 HighHO1   is val([high],HO1).

!FIND SECOND PIVOT HIGH THAT IS BEFORE THE FIRST PIVOT HIGH
 HT2   is scanany(HS,periods,HO1) then OTD.
 HO2   is ^HT2 + Strength.
 HO2dte  is SetDate(HO2).
 HighHO2   is val([high],HO2).
!FIND THIRD PIVOT HIGH THAT IS BEFORE THE SECOND PIVOT HIGH
 HT3   is scanany(HS,periods,HO2) then OTD.
 HO3   is ^HT3 + Strength.
 HO3dte   is SetDate(HO3).
 HighHO3   is val([high],HO3).
!FIND FORTH PIVOT HIGH THAT IS BEFORE THE THIRD PIVOT HIGH
 HT4   is scanany(HS,periods,HO3) then OTD.
 HO4   is ^HT4 + Strength.
 HO4dte  is SetDate(HO4).
 HighHO4   is val([high],HO4).

!FIND FIFTH PIVOT HIGH THAT IS BEFORE THE FORTH PIVOT HIGH
 HT5   is scanany(HS,periods,HO4) then OTD.
 HO5   is ^HT5 + Strength.
 HO5dte   is SetDate(HO5).
 HighHO5   is val([high],HO5).
!_____________________________________________________________
!MACD VALUES AT PIVOT POINTS
 macdLO1   is val([MACD Osc],LO1).
 macdLO2   is val([MACD Osc],LO2).
 macdLO3   is val([MACD Osc],LO3).
 macdLO4   is val([MACD Osc],LO4).
 macdLO5   is val([MACD Osc],LO5).
 macdHO1   is val([MACD Osc],HO1).
 macdHO2   is val([MACD Osc],HO2).
 macdHO3   is val([MACD Osc],HO3).
 macdHO4   is val([MACD Osc],HO4).
 macdHO5    is val([MACD Osc],HO5).


!MACD DIVERGENCE SYSTEM USING PIVOTS
!MACD PARM (12,25,9)
!STOCHASTIC,SK-SD PARM (21,2,2)
 PV  if [close] > 15 and [Volume ESA] > 10000.

 MACDdivgP if PV and [close] < LowLO1
   and LowLO1 > LowLO2
   and [SK] > [SD] and valrule([SK] < [SD],1)
   and [MACD Osc] > macdLO1.
 MACDdivgN if PV and [close] > HighHO1
   and HighHO1 < HighHO2
   and [SK] < [SD] and valrule([SK] > [SD],1)
   and [MACD Osc] < macdHO1.

 PD  is {position days}.
 SX  if PD >= 5.
 LX  if  PD >= 17 .
--Richard Denning
AIQ Systems
richard.denning@earthlink.net
TRADECISION: AUTOMATIC TRENDLINES
Giorgos Siligardos' article, "Building Automatic Trendlines," introduces a simple mechanical method for automatic trendline construction using monoparametric trendlines.
Building trendlines requires identifying peaks and troughs. Therefore, an indicator to identify the price swings is needed.
To construct an active trendline indicator, you can use the Indicator
Builder in Tradecision, allowing you to use the powerful capabilities of
the Improvian Language.
The following is the code for the active trendline indicator:
Active Trendline Indicator
Input
 thresold:"Thresold in percent",1,0,100;
End_input
Var
   array:pivot[4]:=-1;
   sm:=SMA(c,5);
   f1:= 0; f2:=f1;
   pf1:= sm\f1\;
   pf2:= sm\f2\;
   f3:=0;
   pf3:=0;
   n:=historysize;
   pc:=1;
   k:=0;
   y:=0;
End_var
While ((100*abs(pf1-pf2)/min(pf1,pf2)<thresold)and(f2<n)) do
Begin
     f2:=f2+1;
     pf2:= sm\f2\;
End;
f3:=f2;pf3:= sm\f3\;
While (f1<=n and pc<=4) Do
Begin
     While (
            ((100*abs(pf2-pf3)/min(pf2,pf3)<thresold)
            Or
            (((pf1<pf2) And (pf2<=pf3)) Or ((pf1>pf2) And pf2>=pf3))))
            And (f3<n)  Do
     Begin
     If (((pf1<pf2) and (pf2<=pf3)) or ((pf1>pf2) and (pf2>=pf3))) then
     Begin
   f2:=f3; pf2:= sm\f2\;
     End;
     f3:=f3+1; pf3:= sm\f3\;
     End;
      pivot[pc]:=f2; pc:=pc+1;
      f1:=f2; pf1:= sm\f1\;
      f2:=f3; pf2:= sm\f2\;
End;
if (pivot[1]-pivot[3]=0 or pivot[2]-pivot[4]=0) then return inf;
if pc<=4 then return inf;
{Constructing trend}
k:= (sm\pivot[1]\-sm\pivot[3]\)/(pivot[1]-pivot[3]);
k:= (k+ (sm\pivot[2]\- sm\pivot[4]\)/(pivot[2]-pivot[4])) / 2;
y:= pivot[1]*k + c\pivot[1]\;
return y;
A sample chart is shown in Figure 7.
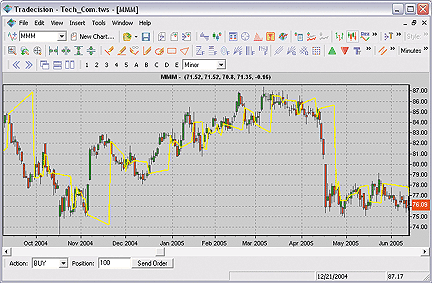
FIGURE 7: TRADECISION, ACTIVE TRENDLINE. On this daily chart of 3M, we can see that the trendline is signaling that the current trends are likely to continue. The threshold value can be corrected for better performance.
To import the indicators and strategy into Tradecision, visit "Tasc
Traders' Tips" area of our website at https://tradecision.com/support/tasc_tips/tasc_traders_tips.htm.
--Alex Grechanowski, Alyuda Research, Inc.GO BACK
sales@alyuda.com, 347 416-6083
www.alyuda.com, www.tradecision.com
OMNITRADER PROFESSIONAL: AUTOMATIC TRENDLINES
For this month's article by Giorgos Siligardos, "Building Automatic Trendlines," we have provided a starting point for users wishing to explore automated mechanical trendlines. The file, "AutomaticTrendlines.txt," uses pivot points to determine mechanically testable historical trendlines. An extra option of basing pivots on the average true range rather than a percentage has also been added. The indicator plots the trendlines on the chart, along with the slope of the trendline in the lower pane (Figure 8). The indicator returns the value of the slope when a new trendline is drawn, and zero otherwise.
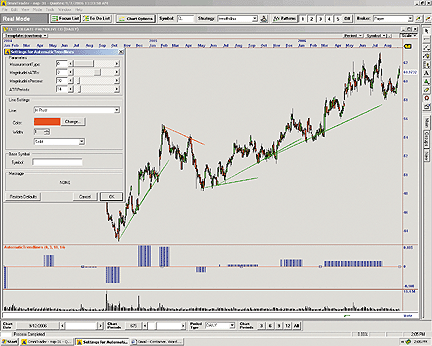
FIGURE 8: OMNITRADER, AUTOMATIC TRENDLINES. Here's an example of automated trendlines plotted on an OmniTrader chart. The slope of the trendline is plotted in the lower pane.To use the automatic trendlines indicator, first copy the file "AutomaticTrendlines.txt" to the "/OT2006/VBA/Indicators" subdirectory of your "Nirvana" folder. Next, open OmniTrader and click Edit:OmniLanguage. You should see the AutomaticTrendlines in the Project Pane. Click "compile." The automatic trendlines indicator will then be ready to use.
For more information and source code, visit https://www.omnitrader.com/ProSI.
The code is also shown here.
--Jeremy Williams, Trading Systems ResearcherGO BACK
Nirvana Systems, Inc.
www.omnitrader.com, www.nirvanasystems.com
STRATASEARCH: AUTOMATIC TRENDLINES
In his article "Building Automatic Trendlines," Giorgos Siligardos concludes by telling us that this is the first time such an algorithm has been made publicly available. He has indeed done a wonderful job. Trendlines have long been the domain of chartists, not quantitative analysts. But now that has changed, and you can now run automated searches and historical evaluations using trendlines with this technique.
The extensive code required for building automatic trendlines is best
implemented through StrataSearch's DLL interface, which allows coding of
custom formulas with the compiler of your choice. We found this quite helpful,
since writing the code in a VC++ compiler turned out to be a snap. The
code we wrote, seen below, was created in Microsoft Visual Studio 6.0.
Figures 9 and 10 show sample charts.
//****************************************************************
// PART 1: Algorithm for the PIVOT
//****************************************************************
DEMOAPI_API int Trendline_PIVOT(Prices *pPrices, Values *pResults,
int nTotDays, Values *pValue1)
{
int N;
int x;
int f1, f2, f3;
double pf1, pf2, pf3;
double threshold;
threshold = pValue1->dValue;
N = nTotDays;
for(x=0; x<N; x++) {
pResults[x].dValue = 0;
pResults[x].chIsValid = 0;
}
f1 = 0;
f2 = f1;
pf1 = pPrices[f1].dClose;
pf2 = pPrices[f2].dClose;
while ( (100*fabs(pf1-pf2)/__min(pf1,pf2)<threshold) &&
(f2<N-1) ) {
f2=f2+1;
pf2= pPrices[f2].dClose;
}
f3=f2;
pf3 = pPrices[f3].dClose;
do {
while (
( (100*fabs(pf2-pf3)/__min(pf2,pf3)<threshold)
||
(((pf1<pf2) && (pf2<=pf3)) || ((pf1>pf2)
&&
(pf2>=pf3))) )
&& (f3<N-1) ) {
if (((pf1<pf2) && (pf2<=pf3)) || ((pf1>pf2)
&&
(pf2>=pf3))) {
f2=f3;
pf2= pPrices[f2].dClose;
}
f3=f3+1;
pf3= pPrices[f3].dClose;
}
if ((f3==N-1)) {
f1=f2;
f2=f3;
pf1= pPrices[f1].dClose;
pf2= pPrices[f2].dClose;
}
if (f2>f1) {
pResults[f2].dValue = 1;
pResults[f2].chIsValid = 'Y';
f1=f2;
f2=f3;
pf1= pPrices[f1].dClose;
pf2= pPrices[f2].dClose;
}
} while (f1 != N-1);
pResults[0].dValue=0;
pResults[0].chIsValid=0;
pResults[N-1].dValue=0;
pResults[N-1].chIsValid=0;
return 0;
}
//****************************************************************
// PART 2: Algorithm for the SI
//****************************************************************
DEMOAPI_API int Trendline_SI(Prices *pPrices, Values *pResults,
int nTotDays, Values *pValue1)
{
int N;
int x, y, f;
double b;
Values *pPivot;
// first obtain the PIVOT data
pPivot = (Values *) malloc(sizeof(Values) * nTotDays);
Trendline_PIVOT(pPrices, pPivot, nTotDays, pValue1);
N = nTotDays;
x=0;
y=0;
while (y<N-1) {
y=y+1;
if ((pPivot[y].dValue!=0) || (y==N-1)) {
b=(pPrices[y].dClose-pPrices[x].dClose)/(y-x);
for(f=x; f<=y; f++) {
pResults[f].dValue = (b*(f-x)+pPrices[x].dClose);
pResults[f].chIsValid = 'Y';
}
x=y;
}
}
free(pPivot);
return 0;
}
//****************************************************************
// PART 1: Construction of upward trendline
//****************************************************************
DEMOAPI_API int Trendline_UPWARD(Prices *pPrices, Values *pResults,
int nTotDays, Values *pValue1, Values *pValue2)
{
double p1, p2, px, b;
int x, x1, x2, f;
BOOL x1OK, x2OK, penetration;
int N;
x1 = (int) pValue1->dValue;
x2 = (int) pValue2->dValue;
N = nTotDays;
p1=pPrices[x1].dClose;
p2=pPrices[x2].dClose;
x=x1;
x1OK=FALSE;
while ((x1OK==FALSE) && (x<x2)) {
px=pPrices[x].dClose;
b=(p2-px)/(x2-x);
f=x+1;
penetration=FALSE;
while ((penetration==FALSE) && (f<=x2)) {
if (pPrices[f].dClose<(b*(f-x)+pPrices[x].dClose))
{
penetration=TRUE;
} else {
f=f+1;
}
}
if (penetration==FALSE) {
x1OK=TRUE;
x1=x;
p1=pPrices[x1].dClose;
} else {
x=x+1;
}
}
if ((x1<x2) && (penetration==FALSE)) {
x=x2;
x2OK=FALSE;
while ((x2OK==FALSE) && (x<N-1)) {
px=pPrices[x].dClose;
b=(px-p1)/(x-x1);
f=x1+1;
penetration=FALSE;
while ((penetration==FALSE) && (f<=N-1)) {
if (pPrices[f].dClose<(b*(f-x1)+pPrices[x1].dClose))
{
penetration=TRUE;
} else {
f=f+1;
}
}
if (penetration==FALSE) {
x2OK=TRUE;
x2=x;
} else {
x=x+1;
}
}
p1=pPrices[x1].dClose;
p2=pPrices[x2].dClose;
b=(p2-p1)/(x-x1);
if ( (b>0) &&
(penetration==FALSE) &&
(x2<N-1) &&
( __max(pPrices[x1].dClose,pPrices[x2].dClose)<
__max(pPrices[x2].dClose,pPrices[N-1].dClose) ) ) {
for(x=x1; x<=N-1; x++) {
pResults[x].dValue = (b*(x-x1)+pPrices[x1].dClose);
pResults[x].chIsValid = 'Y';
}
} else {
// No upward trendline can be constructed;
}
} else {
// No upward trendline can be constructed;
}
return 0;
}
//****************************************************************
// PART 2: Construction of downward trendline
//****************************************************************
DEMOAPI_API int Trendline_DOWNWARD(Prices *pPrices, Values *pResults,
int nTotDays, Values *pValue1, Values *pValue2)
{
double p1, p2, px, b;
int x, x1, x2, f;
BOOL x1OK, x2OK, penetration;
int N;
x1 = (int) pValue1->dValue;
x2 = (int) pValue2->dValue;
N = nTotDays;
p1=pPrices[x1].dClose;
p2=pPrices[x2].dClose;
x=x1;
x1OK=FALSE;
while ((x1OK==FALSE) && (x<x2)) {
px=pPrices[x].dClose;
b=(p2-px)/(x2-x);
f=x+1;
penetration=FALSE;
while ((penetration==FALSE) && (f<=x2)) {
if (pPrices[f].dClose>(b*(f-x)+pPrices[x].dClose)) {
penetration=TRUE;
} else {
f=f+1;
}
}
if (penetration==FALSE) {
x1OK=TRUE;
x1=x;
p1=pPrices[x1].dClose;
} else {
x=x+1;
}
}
if ((x1<x2) && (penetration==FALSE)) {
x=x2;
x2OK=FALSE;
while ((x2OK==FALSE) && (x<N-1)) {
px=pPrices[x].dClose;
b=(px-p1)/(x-x1);
f=x1+1;
penetration=FALSE;
while ((penetration==FALSE) && (f<=N-1)) {
if (pPrices[f].dClose>(b*(f-x1)+pPrices[x1].dClose))
{
penetration=TRUE;
} else {
f=f+1;
}
}
if (penetration==FALSE) {
x2OK=TRUE;
x2=x;
} else {
x=x+1;
}
}
p1=pPrices[x1].dClose;
p2=pPrices[x2].dClose;
b=(p2-p1)/(x-x1);
if ( (b<0) &&
(penetration==FALSE) &&
(x2<N-1) &&
( __min(pPrices[x1].dClose,pPrices[x2].dClose)>
__min(pPrices[x2].dClose,pPrices[N-1].dClose) ) ) {
for(x=x1; x<=N-1; x++) {
pResults[x].dValue = (b*(x-x1)+pPrices[x1].dClose);
pResults[x].chIsValid = 'Y';
}
} else {
// No downward trendline can be constructed;
}
} else {
// No downward trendline can be constructed;
}
return 0;
}
//****************************************************************
// Milestones and Trendline Creation
//****************************************************************
DEMOAPI_API int Trendlines(Prices *pPrices, Values *pResults,
int nTotDays, Values *pValue1, Values *pValue2)
{
int f, N, pivotsfound;
Values *pSI;
typedef struct tagPIVOT {
int pivottype;
int position;
} PIVOT;
PIVOT piv[5];
int isTrendlineConstructed=0;
Values vt1;
Values vt2;
// first get the Swing Indicator values
pSI = (Values *) malloc(sizeof(Values) * nTotDays);
Trendline_SI(pPrices, pSI, nTotDays, pValue1);
N = nTotDays;
f=N-3;
pivotsfound=0;
while ((f>3) && (pivotsfound<4)) {
if ( (pSI[f].dValue<= pSI[f+1].dValue) &&
(pSI[f-1].dValue>= pSI[f].dValue) ) {
pivotsfound=pivotsfound+1;
piv[5-pivotsfound].pivottype= +1;
piv[5-pivotsfound].position= f;
}
if ( (pSI[f].dValue>= pSI[f+1].dValue) &&
(pSI[f-1].dValue<= pSI[f].dValue) ) {
pivotsfound=pivotsfound+1;
piv[5-pivotsfound].pivottype= -1;
piv[5-pivotsfound].position= f;
}
f=f-1;
}
if (pivotsfound==4) {
if ((piv[2].pivottype==1) &&
(piv[4].pivottype==1) &&
(pPrices[piv[2].position].dClose<pPrices[piv[4].position].dClose) &&
(__max(pPrices[piv[2].position].dClose,pPrices[piv[4].position].dClose)<
__max(pPrices[piv[4].position].dClose,pPrices[N-1].dClose))) {
// Construct Upward TrendLine Using Milestones
vt1.dValue = piv[2].position;
vt2.dValue = piv[4].position;
Trendline_UPWARD(pPrices, pResults, nTotDays, &vt1,
&vt2);
isTrendlineConstructed = 1;
} else {
if ((piv[2].pivottype==-1) &&
(piv[4].pivottype==-1) &&
(pPrices[piv[2].position].dClose>pPrices[piv[4].position].dClose) &&
(__min(pPrices[piv[2].position].dClose,pPrices[piv[4].position].dClose)>
__min(pPrices[piv[4].position].dClose,pPrices[N-1].dClose))) {
// Construct Downward TrendLine Using Milestones
vt1.dValue = piv[2].position;
vt2.dValue = piv[4].position;
Trendline_DOWNWARD(pPrices, pResults, nTotDays,
&vt1, &vt2);
isTrendlineConstructed = 1;
}
}
}
if ((pivotsfound>=3) && !isTrendlineConstructed ) {
if ((piv[1].pivottype==1) &&
(piv[3].pivottype==1) &&
(pPrices[piv[1].position].dClose<pPrices[piv[3].position].dClose) &&
(__max(pPrices[piv[1].position].dClose,pPrices[piv[3].position].dClose)<
__max(pPrices[piv[3].position].dClose,pPrices[N-1].dClose))) {
// Construct Upward TrendLine Using Milestones
vt1.dValue = piv[1].position;
vt2.dValue = piv[3].position;
Trendline_UPWARD(pPrices, pResults, nTotDays, &vt1,
&vt2);
isTrendlineConstructed = 1;
} else {
if ((piv[1].pivottype==-1) &&
(piv[3].pivottype==-1) &&
(pPrices[piv[1].position].dClose>pPrices[piv[3].position].dClose) &&
(__min(pPrices[piv[1].position].dClose,pPrices[piv[3].position].dClose)>
__min(pPrices[piv[3].position].dClose,pPrices[N-1].dClose))) {
// Construct Downward TrendLine Using Milestones
vt1.dValue = piv[1].position;
vt2.dValue = piv[3].position;
Trendline_DOWNWARD(pPrices, pResults, nTotDays,
&vt1, &vt2);
isTrendlineConstructed = 1;
}
}
}
if (pivotsfound<3) {
// No Point Milestones Can Be Found;
}
free(pSI);
return 0;
}
FIGURE 9: STRATASEARCH, SWING INDICATOR. The swing indicator helps identify peaks and troughs. In this example, a 20% threshold is used to identify a reversal.As with all other StrataSearch Traders' Tips contributions, additional information, including plug-ins, can be found in the Shared Area of our user forum. This month's plug-in also contains a number of prebuilt trading rules that will allow you to include trendline evaluations in your automated searches.
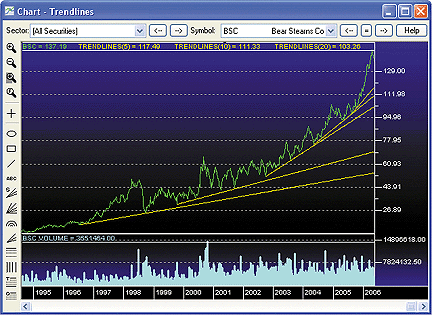
FIGURE 10: STRATASEARCH, TRENDLINES IN ACTION. In this example of weekly bars from Bear Stearns, the trendlines (in yellow) have been plotted in 5%, 10%, 20%, 50%, and 80% thresholds.
GO BACK
--Pete Rast, Avarin Systems, Inc.
www.StrataSearch.com
TECHNIFILTER PLUS: AUTOMATIC TRENDLINES
Technifilter Plus comes with standard formulas for drawing simple computer-generated trendlines based on two significant points.
As the positioning of trendlines can be very subjective, the number of periods between the two points can be varied to suit personal preferences.
Four formulas are provided:
1. HIGH_LINE(50)
This formula computes a trendline drawn through the highest high within the last 50 periods and
the highest high in the 50 periods before that. The periods can be altered; change the parameter
as required.
Parameters; 50
Formula:
[1]: {drops} (HY1*(H<HY1)*(HY1>=HY2))
[2]: {y0-point} [1]M&1Y000
[3]: {x0-point} [1]M'&1Y000 + 1
[4]: {x-point} CU13Y000-CU13
[5]: {y-point} (H *([4] < [3]) *([4]>2)) + (T=0) * [2]
[6]: {slope} ((([2]-[5]) / ([3]-[4])U6) + (T=0) *10000)N&1Y000 * ([3]>10)
[7]: {line} [2] + [6] * ([4]-[3])
 2. HIGH_TL(50)
This formula looks back over the last 50 periods and locates the highest peak in that period. It
then computes the downward-sloped trendline that goes through this peak and sits on top of the
bars to the right of the peak, ignoring the last day. The periods can be altered; change the
parameter as required.
Formula:
[1]: {drops} (HY1*(H<HY1))
[2]: {slope} ([1]M&1Y000 - [1]Y&1M&1Y000)/ ([1]Y&1M'&1Y000 + &1 - [1]M'&1Y000)
[3]: {y-point} [1]M&1Y000
[4]: {x-point} [1]M'&1Y000 + 1
[5]: {line} [3] + [2] * (CU13-TY000+[4])
2. HIGH_TL(50)
This formula looks back over the last 50 periods and locates the highest peak in that period. It
then computes the downward-sloped trendline that goes through this peak and sits on top of the
bars to the right of the peak, ignoring the last day. The periods can be altered; change the
parameter as required.
Formula:
[1]: {drops} (HY1*(H<HY1))
[2]: {slope} ([1]M&1Y000 - [1]Y&1M&1Y000)/ ([1]Y&1M'&1Y000 + &1 - [1]M'&1Y000)
[3]: {y-point} [1]M&1Y000
[4]: {x-point} [1]M'&1Y000 + 1
[5]: {line} [3] + [2] * (CU13-TY000+[4])
 3. LOW_TL(50)
Comment: This multiline formula computes a trendline drawn through the lowest low within the
last 50 days and the lowest low in the 50 days before that. The periods can be altered; change
the parameter as required.
Formula:
[1]: {rises} (LY1*(L>LY1))+(T=0)*100000
[2]: {slope} ([1]N&1Y000-[1]Y&1N&1Y000)/ ([1]Y&1N'&1Y000 + &1 - [1]N'&1Y000)
[3]: {y-point} [1]N&1Y000
[4]: {x-point} [1]N'&1Y000 + 1
[5]: {line} [3] + [2]*(CU13-TY000+[4])
3. LOW_TL(50)
Comment: This multiline formula computes a trendline drawn through the lowest low within the
last 50 days and the lowest low in the 50 days before that. The periods can be altered; change
the parameter as required.
Formula:
[1]: {rises} (LY1*(L>LY1))+(T=0)*100000
[2]: {slope} ([1]N&1Y000-[1]Y&1N&1Y000)/ ([1]Y&1N'&1Y000 + &1 - [1]N'&1Y000)
[3]: {y-point} [1]N&1Y000
[4]: {x-point} [1]N'&1Y000 + 1
[5]: {line} [3] + [2]*(CU13-TY000+[4])
 4. LO_LINE(50)
This formula looks back over the last 50 periods and locates the lowest valley in that period.
It then computes the upward-sloped trendline that goes through this valley and sits below the
bottom of the bars to the right of the valley, ignoring the last day. The periods can be
altered; change the parameter as required.
Formula:
[1]: {rises} ((LY1*(L>LY1)*(LY1<=LY2))) + (T=0) *10000
[2]: {y0-point} [1]N&1Y000
[3]: {x0-point} [1]N'&1Y000 + 1
[4]: {x-point} CU13Y000-CU13
[5]: {y-point} (L *([4] < [3])*([4]>0)) + (T=0) * [2]
[6]: {slope} ((([2]-[5]) / ([3]-[4])U6) - (T=0) *10000)M&1Y000 * ([3]>10)
[7]: {line} [2] + [6] * ([4]-[3])
4. LO_LINE(50)
This formula looks back over the last 50 periods and locates the lowest valley in that period.
It then computes the upward-sloped trendline that goes through this valley and sits below the
bottom of the bars to the right of the valley, ignoring the last day. The periods can be
altered; change the parameter as required.
Formula:
[1]: {rises} ((LY1*(L>LY1)*(LY1<=LY2))) + (T=0) *10000
[2]: {y0-point} [1]N&1Y000
[3]: {x0-point} [1]N'&1Y000 + 1
[4]: {x-point} CU13Y000-CU13
[5]: {y-point} (L *([4] < [3])*([4]>0)) + (T=0) * [2]
[6]: {slope} ((([2]-[5]) / ([3]-[4])U6) - (T=0) *10000)M&1Y000 * ([3]>10)
[7]: {line} [2] + [6] * ([4]-[3])
 To locate a break of this line with the close falling below the trendline, add an extra
formula line:
[8]: (c-[7])U2-TY1
To locate a break of this line with the close falling below the trendline, add an extra
formula line:
[8]: (c-[7])U2-TY1
These formulas can be used to scan and filter stocks falling below, or
breaking above, their automatic trendlines. Visit the home of Technifilter
Plus at www.technifilter.com to download these formulas and filter reports.
GO BACK
--Benzie Pikoos, Brightspark
+61 8 9375-1178 , sales@technifilter.com
www.technifilter.com
ENSIGN SOFTWARE: AUTOMATIC TRENDLINES
Ensign Windows already contains an Auto Trends feature, and thus, we won't implement Giorgos Siligardos' ideas using Ensign's programming language. The author's methods are very similar to the implementation used in Ensign Windows to implement Auto Trends. Ensign's Auto Trends feature has additional options that make the tool flexible and powerful.
Ensign's methodology for implementing automated trendlines is proprietary yet very similar to the concepts published in Siligardos' article. Ensign's tool also works well on semilog-scaled charts. Ensign's implementation goes even further to offer penetration alarms, parallel channel lines, typical slope lines, Gann 1x1, support and resistance, and breakout lines.
Figure 11 shows the Auto Trend lines as the thicker blue lines, and the optional parallel channel lines as the dotted red lines. The candlesticks illustrate Ensign's rocket-style, where the thicker wick (thrust) is on the open side of the candle body, and the thinner wick (nose) is on the close side of the candle body. The candle bodies are colored based on the Dunnigan color bars study: up bars in green, down bars in red, inside-range bars in blue, and outside range bars in orange. The variable width of the candle body is using Ensign's Equi-Volume feature. Fatter candles indicate periods of higher volume. Skinny candle bodies indicate periods of lighter volume, which is often the case for the blue inside-range bars.
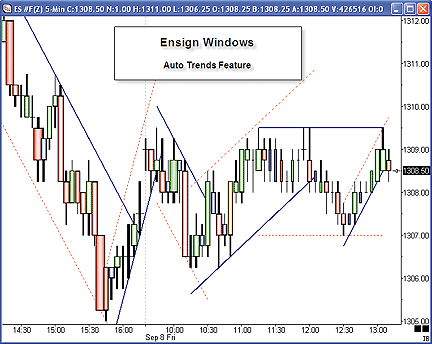
FIGURE 11: ENSIGN SOFTWARE, AUTO TRENDS. Here is a chart of the ES continuation contract, five-minute bars, with Auto Trends.A free seven-day trial period of the Ensign Windows program is available for download from the Ensign website.
--Howard Arrington, Ensign SoftwareGO BACK
www.ensignsoftware.com
VT TRADER: ACTIVE TRADE MANAGEMENT SYSTEM
This month, Visual Trading Systems would like to answer one of the most frequently asked questions we receive from VT Trader users, which is, "How can I add stop-loss, trailing stop-loss, and limit profit conditional order logic to my trading system?"
In response to this question, we've created the Active Trade Management (Atm) system for VT Trader (Figure 12). By using this trading system, the user can manually open a buy or sell position and then allow the ATM system to "manage" the open position by providing conditional order logic within the confines of an automated trading system.
The ATM system provides logic for the following types of exit criteria: an initial stop-loss, applied breakeven stop-loss after n-pips, trailing stop-loss (ATR-based or pip-based), and/or limit profit target. Each of the available options can be enabled or disabled and configured independently.
We'll be offering this trading system, along with full user documentation,
for download in our user forums. The VT Trader code and instructions for
creating the ATM system are available there as well as here.
1. Navigator Window>Tools>Trading Systems Builder>[New] button
2. In the Indicator Bookmark, type the following text for each field:
Name: VT-Active Trade Management (ATM) System
Short Name: vt_ATMSystem
Label Mask: Active %TED:ls% @ %TEP% (Initial Stoploss: %InitialStoplossMode:ls% ,
 %InitialStoploss% | BreakEven Stoploss: %BEStoplossMode:ls%, %BEP% | Trailing Stoploss:
 %TrailingStoplossMode:ls% , %TrailingStoplossType:ls% | Profit Target: %ProfitTargetMode:ls%,
 %ProfitTarget%)
3. In the Input Bookmark, create the following variables:
[New] button... Name: TEBN , Display Name: Trade Entry Bar Number , Type: integer , Default: 0
[New] button... Name: TED , Display Name: Trade Entry Direction , Type: Enumeration , Default:
 click [...] button, [New] button, then create the following entries: BUY_Trade, SELL_Trade;
 then, click [OK] button; Default: BUY_Trade
[New] button... Name: TEP , Display Name: Trade Entry Price , Type: float , Default: 0.0000
[New] button... Name: InitialStoplossMode , Display Name: Enable Initial Stoploss? , Type:
 Enumeration , Default: click [...] button, [New] button, then create the following entries:
 Yes, No; then, click [OK] button; Default: No
[New] button... Name: InitialStoploss , Display Name: Initial Stoploss (in Pips) , Type:
 integer , Default: 20
[New] button... Name: BEStoplossMode , Display Name: Enable BreakEven Stoploss? , Type:
 Enumeration , Default: click [...] button, [New] button, then create the following entries:
 Yes, No; then, click [OK] button; Default: No
[New] button... Name: BEP , Display Name: Set BreakEven Stoploss After n-Pips , Type: integer ,
 Default: 20
[New] button... Name: TrailingStoplossMode , Display Name: Enable Trailing Stoploss? , Type:
 Enumeration , Default: click [...] button, [New] button, then create the following entries:
 Yes, No; then, click [OK] button; Default: No
[New] button... Name: TrailingStoplossType , Display Name: Trailing Stoploss Type , Type:
 Enumeration ,  Default: click [...] button, [New] button, then create the following entries:
 ATR_Based, Pip_Based; then, click [OK] button; Default: Pip_Based
[New] button... Name: TrailingStoploss , Display Name: Trailing Stoploss (in Pips) , Type:
 integer , Default: 20
[New] button... Name: ATRper , Display Name: ATR Periods (if ATR Trailing Stoploss) , Type:
 integer , Default: 10
[New] button... Name: atrmultiplier , Display Name: ATR Multiplier (if ATR Trailing Stoploss) ,
 Type: float , Default: 3.0000
[New] button... Name: ProfitTargetMode , Display Name: Enable Profit Target? ,  Type:
 Enumeration , Default: click [...] button, [New] button, then create the following entries:
 Yes, No; then, click [OK] button; Default: No
[New] button... Name: ProfitTarget , Display Name: Profit Target (in Pips) , Type: integer ,
 Default: 20
4. In the Formula Bookmark, copy and paste the following formula:
{Assign Each Char Bar A Number}
Barnum:= BarCount();
{***********************************************}
{Determine the Pip Value for the currency chart being used}
_InitialStoploss:= InitialStoploss * SymbolPoint();
_BEP:= BEP * SymbolPoint();
_TrailingStoploss:= TrailingStoploss * SymbolPoint();
_ProfitTarget:= ProfitTarget * SymbolPoint();
{***********************************************}
LongEntrySignal:= BuyTradeActive=0 AND TED=0 AND Barnum=TEBN;
LongEntryPrice:= TEP;
BarsSinceLongEntry:= BarsSince(LongEntrySignal);
LongEntryInitialStop:= if(BuyTradeActive=1 OR LongEntrySignal OR LongExitSignal,
 LongEntryPrice - _InitialStoploss, null);
DisplayLongEntryInitialStop:= if(InitialStoplossMode=0, LongEntryInitialStop, null);
LongEntryBEStoplossFlag:= SignalFlag(BuyTradeActive=1 AND C >= (LongEntryPrice + _BEP),
 LongExitSignal);
LongEntryBEStoploss:= if(LongEntryBEStoplossFlag=1 OR LongEntrySignal OR LongExitSignal,
 LongEntryPrice, null);
DisplayLongEntryBEStoploss:= if(BEStoplossMode=0, LongEntryBEStoploss, null);
LongEntryPipTrailingStop:= if(BuyTradeActive=1 OR LongEntrySignal OR LongExitSignal,
 max((C - _TrailingStoploss), PREV(LongEntryPrice - _TrailingStoploss)), null);
LongEntryATRTrailingStop:= if(BuyTradeActive=1 OR LongEntrySignal OR LongExitSignal,
 max(HHV(H,BarsSinceLongEntry) - (ATR(ATRper) * atrmultiplier), PREV(valuewhen(1,
 LongEntrySignal,H) - (ATR(ATRper) * atrmultiplier))), null);
DisplayLongEntryTrailingStop:= if(TrailingStoplossMode=0 AND TrailingStoplossType=1,
 LongEntryPipTrailingStop, if(TrailingStoplossMode=0 AND TrailingStoplossType=0,
 LongEntryATRTrailingStop, null));
LongEntryProfitTarget:= if(BuyTradeActive=1 OR LongEntrySignal OR LongExitSignal,
 LongEntryPrice + _ProfitTarget, null);
DisplayLongEntryProfitTarget:= if(ProfitTargetMode=0, LongEntryProfitTarget, null);
LongExitSignal:= (BuyTradeActive=1 AND InitialStoplossMode=0 AND Cross(LongEntryInitialStop,C))
              OR (BuyTradeActive=1 AND BEStoplossMode=0 AND Cross(LongEntryBEStoploss,C))
              OR (BuyTradeActive=1 AND TrailingStoplossMode=0 AND TrailingStoplossType=1 AND
                  Cross(LongEntryPipTrailingStop,C))
              OR (BuyTradeActive=1 AND TrailingStoplossMode=0 AND TrailingStoplossType=0 AND
                  Cross(LongEntryATRTrailingStop,C))
              OR (BuyTradeActive=1 AND ProfitTargetMode=0 AND Cross(C,LongEntryProfitTarget));
ShortEntrySignal:= SellTradeActive=0 AND TED=1 AND Barnum=TEBN;
ShortEntryPrice:= TEP;
BarsSinceShortEntry:= BarsSince(ShortEntrySignal);
ShortEntryInitialStop:= if(SellTradeActive=1 OR ShortEntrySignal OR ShortExitSignal,
 ShortEntryPrice + _InitialStoploss, null);
DisplayShortEntryInitialStop:= if(InitialStoplossMode=0, ShortEntryInitialStop, null);
ShortEntryBEStoplossFlag:= SignalFlag(SellTradeActive=1 AND C <= (ShortEntryPrice - _BEP),
 ShortExitSignal);
ShortEntryBEStoploss:= if(ShortEntryBEStoplossFlag=1 OR ShortEntrySignal OR ShortExitSignal,
 ShortEntryPrice, null);
DisplayShortEntryBEStoploss:= if(BEStoplossMode=0, ShortEntryBEStoploss, null);
ShortEntryPipTrailingStop:= if(SellTradeActive=1 OR ShortEntrySignal OR ShortExitSignal,
 min((C + _TrailingStoploss), PREV(ShortEntryPrice + _TrailingStoploss)), null);
ShortEntryATRTrailingStop:= if(SellTradeActive=1 OR ShortEntrySignal OR ShortExitSignal,
 min(LLV(L,BarsSinceShortEntry) + (ATR(ATRper) * atrmultiplier),
 PREV(valuewhen(1,ShortEntrySignal,L) + (ATR(ATRper) * atrmultiplier))), null);
DisplayShortEntryTrailingStop:= if(TrailingStoplossMode=0 AND TrailingStoplossType=1,
 ShortEntryPipTrailingStop, if(TrailingStoplossMode=0 AND TrailingStoplossType=0,
 ShortEntryATRTrailingStop, null));
ShortEntryProfitTarget:= if(SellTradeActive=1 OR ShortEntrySignal OR ShortExitSignal,
 ShortEntryPrice - _ProfitTarget, null);
DisplayShortEntryProfitTarget:= if(ProfitTargetMode=0, ShortEntryProfitTarget, null);
ShortExitSignal:= (SellTradeActive=1 AND InitialStoplossMode=0 AND Cross(C,ShortEntryInitialStop))
               OR (SellTradeActive=1 AND BEStoplossMode=0 AND Cross(C,ShortEntryBEStoploss))
               OR (SellTradeActive=1 AND TrailingStoplossMode=0 AND TrailingStoplossType=1 AND
                   Cross(C,ShortEntryPipTrailingStop))
               OR (SellTradeActive=1 AND TrailingStoplossMode=0 AND TrailingStoplossType=0 AND
                   Cross(C,ShortEntryATRTrailingStop))
               OR (SellTradeActive=1 AND ProfitTargetMode=0 AND Cross(ShortEntryProfitTarget,C));
{Simulated Open Trade Determination and Trade Direction}
BuyTradeActive:= SignalFlag(LongEntrySignal,LongExitSignal);
SellTradeActive:= SignalFlag(ShortEntrySignal,ShortExitSignal);
{Create Auto-Trading Functionality}
CloseBuy:= LongExitSignal and AccountStatus()=Buy_Position_Active;
CloseSell:= ShortExitSignal and AccountStatus()=Sell_Position_Active;
{***********************************************}
5. In the Output Bookmark, create the following variables:
[New] button...
Var Name: Barnum
Name: Chart Bar Number
Description: Chart Bar Number
* Checkmark: Indicator Output
Select Indicator Output Bookmark
Color: black
Line Width: thin
Line Style: histogram
Placement: Frame 1
[OK] button...
[New] button...
Var Name: LongEntrySignal
Name: LongEntrySignal
Description: Long Entry Signal Alert
* Checkmark: Graphic Enabled
* Checkmark: Alerts Enabled
Select Graphic Bookmark
Font [...]: Up Arrow
Size: Medium
Color: Blue
Symbol Position: Below price plot
Select Alerts Bookmark
Alerts Message: Long Entry Signal!
Choose sound for audible alert
[OK] button...
[New] button...
Var Name: DisplayLongEntryInitialStop
Name: BUY Trade Initial Stoploss
Description: BUY Trade Initial Stoploss
* Checkmark: Indicator Output
Select Indicator Output Bookmark
Color: blue
Line Width: slightly thicker
Line Style: solid line
Placement: Price Frame
[New] button...
Var Name: DisplayLongEntryBEStoploss
Name: BUY Trade BreakEven Stoploss
Description: BUY Trade BreakEven Stoploss
* Checkmark: Indicator Output
Select Indicator Output Bookmark
Color: light blue
Line Width: slightly thicker
Line Style: solid line
Placement: Price Frame
[New] button...
Var Name: DisplayLongEntryTrailingStop
Name: BUY Trade Trailing Stoploss
Description: BUY Trade Trailing Stoploss
* Checkmark: Indicator Output
Select Indicator Output Bookmark
Color: blue
Line Width: thin
Line Style: dashed line
Placement: Price Frame
[New] button...
Var Name: DisplayLongEntryProfitTarget
Name: BUY Trade Limit Profit Target
Description: BUY Trade Limit Profit Targets
* Checkmark: Indicator Output
Select Indicator Output Bookmark
Color: dark blue
Line Width: slightly thicker
Line Style: solid line
Placement: Price Frame
[New] button...
Var Name: LongExitSignal
Name: LongExitSignal
Description: Long Exit Signal Alert
* Checkmark: Graphic Enabled
* Checkmark: Alerts Enabled
Select Graphic Bookmark
Font [...]: Exit Sign
Size: Medium
Color: Blue
Symbol Position: Above price plot
Select Alerts Bookmark
Alerts Message: Long Exit Signal!
Choose sound for audible alert
[OK] button...
[New] button...
Var Name: ShortEntrySignal
Name: ShortEntrySignal
Description: Short Entry Signal Alert
* Checkmark: Graphic Enabled
* Checkmark: Alerts Enabled
Select Graphic Bookmark
Font [...]: Down Arrow
Size: Medium
Color: Red
Symbol Position: Above price plot
Select Alerts Bookmark
Alerts Message: Short Entry Signal!
Choose sound for audible alert
[OK] button...
[New] button...
Var Name: DisplayShortEntryInitialStop
Name: SELL Trade Initial Stoploss
Description: SELL Trade Initial Stoploss
* Checkmark: Indicator Output
Select Indicator Output Bookmark
Color: red
Line Width: slightly thicker
Line Style: solid line
Placement: Price Frame
[New] button...
Var Name: DisplayShortEntryBEStoploss
Name: SELL Trade BreakEven Stoploss
Description: SELL Trade BreakEven Stoploss
* Checkmark: Indicator Output
Select Indicator Output Bookmark
Color: light red
Line Width: slightly thicker
Line Style: solid line
Placement: Price Frame
[New] button...
Var Name: DisplayShortEntryTrailingStop
Name: SELL Trade Trailing Stoploss
Description: SELL Trade Trailing Stoploss
* Checkmark: Indicator Output
Select Indicator Output Bookmark
Color: red
Line Width: thin
Line Style: dashed line
Placement: Price Frame
[New] button...
Var Name: DisplayShortEntryProfitTarget
Name: SELL Trade Limit Profit Target
Description: SELL Trade Limit Profit Targets
* Checkmark: Indicator Output
Select Indicator Output Bookmark
Color: dark red
Line Width: slightly thicker
Line Style: solid line
Placement: Price Frame
[New] button...
Var Name: ShortExitSignal
Name: ShortExitSignal
Description: Short Exit Signal Alert
* Checkmark: Graphic Enabled
* Checkmark: Alerts Enabled
Select Graphic Bookmark
Font [...]: Exit Sign
Size: Medium
Color: Red
Symbol Position: Below price plot
Select Alerts Bookmark
Alerts Message: Short Exit Signal!
Choose sound for audible alert
[OK] button...
[New] button...
Var Name: BuyTradeActive
Name: BuyTradeActive
Description: Active Buy Trade
* Checkmark: Trends enabled
Select Trends enabled Bookmark
Display Vertical Lines: Checkmarked
Background: blue
Pattern: solid
Label: Diagonal up arrow
Label Color: light blue
[OK] button...
[New] button...
Var Name: SellTradeActive
Name: SellTradeActive
Description: Active Sell Trade
* Checkmark: Trends enabled
Select Trends enabled Bookmark
Display Vertical Lines: Checkmarked
Background: red
Pattern: solid
Label: Diagonal down arrow
Label Color: light red
[OK] button...
[New] button...
Var Name: CloseBuy
Name: CloseBuy
Description: Automated Close Buy Trade Command
* Checkmark: Trading Enabled
Select Trading Bookmark
Trade Action: Sell
Traders Range: 5
Hedge: no checkmark
EachTick Count: 1
[OK] button...
[New] button...
Var Name: CloseSell
Name: CloseSell
Description: Automated Close Sell Trade Command
* Checkmark: Trading Enabled
Select Trading Bookmark
Trade Action: Buy
Traders Range: 5
Hedge: no checkmark
EachTick Count: 1
[OK] button...
6. Click the "Save" icon to finish building the ATM System.
Before using the ATM System, please ensure you have read through and fully understand the user
 documentation that will be provided for this trading system. To attach the ATM System to a chart,
 right-click with the mouse within the chart window, select "Add Trading System" -> "VT-Active
 Trade Management (ATM) System" from the list. Once attached to the chart the parameters can be
 customized by right-clicking with the mouse over the displayed trading system label and selecting
 "Edit Trading Systems Properties".
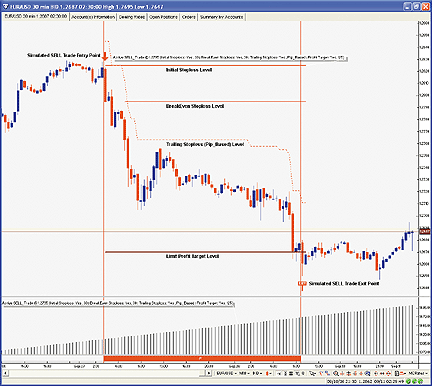
FIGURE 12: VT TRADER, ACTIVE TRADE MANAGEMENT ATM SYSTEM. Here is a 30-minute candlestick chart of EUR/USD with the ATM system applied.
To learn more about VT Trader, visit www.cmsfx.com.
--Chris Skidmore
Visual Trading Systems, LLC (courtesy of Cms Forex)
(866) 51-CMSFX, trading@cmsfx.com
www.cmsfx.com