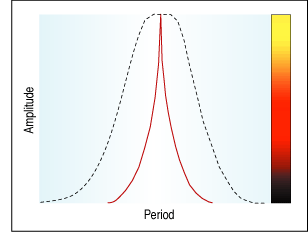
FIGURE 1: SPECTRUM CONVERSION. Here the width of the spectral line is narrow (as seen by the spike in the solid line). This means the cycle is identified with high resolution.
QUANTITATIVE ANALYSIS
Dominant Cycle = Fog Lights
Fourier Transform For Tradersby John F. Ehlers
When market conditions are variable, adapting to them becomes a challenge. Here's how you can use a dominant cycle to tune the relevant indicators so you don't have to drive through the fog.IT is intrinsically wrong to use a 14-bar relative strength index (RSI), a nine-bar stochastic, a 5/25 double moving average crossover, or any other fixed-length indicator when the market conditions are variable. It's like driving on a curving mountain road in a fog bank with your cruise control locked — and you've desperately got to clean your eyeglasses.
That market conditions are continuously changing is not even a subject of debate. There have been a number of attempts to adapt to changing market conditions. Volatility-based nonlinear moving averages are just one example of adapting to market changes. As I come from an information theory background, my answer to the question of how to adapt to changing conditions is to first measure the dominant market cycle and then tune the various indicators to that cycle period, or at least a fraction of it. Theoretically, an RSI performs best when the computation period is just half of a cycle period — that is, when all the movement is in one direction and then reverses so all the movement is in the other direction over the period of one cycle — and you get a full amplitude swing from the RSI.
FOURIER TRANSFORMS
Make no mistake: Measuring market cycles is difficult. Not only is there the problem of simultaneously solving for frequency, amplitude, and phase to arrive at an accurate estimate, but we must also realize the measurement is being made in a low signal-to-noise environment. Further, we must be concerned with the responsiveness of the measuring technique to capture the cycle periods that are continuously changing without introducing transient artifacts into the measurement. A variety of spectrum estimation techniques is available, ranging from the Fourier periodogram to modern high-resolution spectral analysis approaches.
I have long railed against the use of Fourier transforms in estimating market cycles because of their lack of resolution. Figure 1 represents a typical spectrum measurement. The horizontal axis is the frequency (or its reciprocal, cycle period) scale. The vertical axis is the amplitude scale. The frequency with the highest amplitude identifies the measured cycle.
If the width of the spectral line is narrow, just a spike like the solid line, then the cycle is identified with high resolution. If we have a high-resolution technique we could, in fact, identify two closely spaced cycle periods if they are present in the data. On the other hand, if we have a low-resolution measurement technique and the width of the spectral line is broad, two closely spaced cycles could be averaged together and you would not be able to identify them, as demonstrated by the dotted line (Figure 1).

FIGURE 1: SPECTRUM CONVERSION. Here the width of the spectral line is narrow (as seen by the spike in the solid line). This means the cycle is identified with high resolution.
Excerpted from an article originally published in the January 2007
issue of Technical Analysis of STOCKS & COMMODITIES magazine.
All rights reserved. © Copyright 2006, Technical Analysis,
Inc.