Alert, Adapt, Adjust
Directional To Delta Neutral
by Chris Tyler
Staying alert to new opportunities and changing market conditions means you have to adjust your positions. Here's how.
Wall Street adage says winners take care of themselves. The reality, however, is that "winners" are traders who manage all of their trades in a disciplined manner. Seasoned traders remain successful by staying alert to fresh opportunities and changing market conditions, whether that means keeping losses small or adjusting a winning trade into a smarter position. By adhering to this discipline we reduce our stress and move toward more consistent results over the long run.
The idea of adapting to changing market conditions by making adjustments to positions is a familiar process for seasoned option traders. For new traders, however, the concept can seem daunting because there are few written guidelines or rules established for when and how to make adjustments. The truth is there is no right or wrong way to adjust a position. Instead, it is often dependent on the situation, but putting that process to work on a consistent basis increases the chances of success over the long run.
To illustrate this process, this two-part article provides a recent trading case study. The analysis follows a bullish pattern low known as a butterfly combined with a double bottom in XM Satellite Radio (XMSR). First, we'll define the technicals behind those patterns, how those relationships fit in with XMSR, and then investigate a proper long call purchase based on that evidence. In the second part, the article explores the adjustment process by developing the long call into a synthetic straddle. We'll show how this dynamic adjustment can reflect the shifting expectations of the original trade and how it might better serve the goal of profitability over the long run.
BULLISH BUTTERFLY
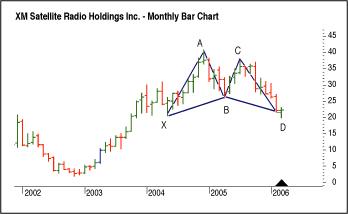
The butterfly is a chart formation that technicians use to locate potential tops and bottoms in an investment security. The formation is based on price action in relation to specific Fibonacci requirements. The pattern requires the completion of five key price pivots on the chart: X, A, B, C, and D. When the pattern is complete, it will have some characteristics of a butterfly, as two wings can be seen on the price chart if traders connect the essential pivots with two triangular subpatterns.

FIGURE 1: XMSR BUTTERFLY PATTERN. Since the butterfly pattern indicates a reversal it means that prices will move counter to the existing trend.
...Continued in the January issue of Technical Analysis of STOCKS
& COMMODITIES
Excerpted from an article originally published in the January 2007
issue of Technical Analysis of STOCKS & COMMODITIES magazine.
All rights reserved. © Copyright 2006, Technical Analysis,
Inc.
Return to January 2007 Contents