Sometimes Now And Sometimes Then
When To Trade With Cycles
When should you trade the cycle mode in a market and when should you trade the trend mode? Find out with this indicator.
IN theory, trading with cycles is easy --
just buy at the valley and sell at the crest. This is just a variation
of the old buy-low, sell-high dictum. In practice, however, trading
with cycles is far more difficult. Just for openers, the very existence
of market cycles is ephemeral and we must jump on them quickly to take
advantage of any market inefficiency they represent. This is demonstrated
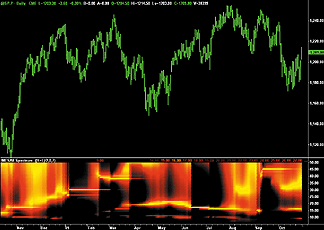
by the Mesa8 measurement of the historical spectra of the Standard &
Poor's futures contract seen in Figure 1. The spectra are shown colorized
over a 20-decibel range from white-hot, through red-hot, to ice-cold. Colorizing
this way enables the display in a subgraph in synchronism with the bar
chart. Figure 1 clearly shows how the dominant cycle in the data varies
with time.

FIGURE 1: MESA8-MEASURED SPECTRA. On this chart of the S&P futures contract you can see that the dominant cycle in the data varies with time.
In addition, there are a number of other conditions that make trading with cycles more difficult besides temporal variability, perhaps to the point that the real question is, "When should I not trade with cycles?" The most significant among these conditions are signal to noise ratios, being swamped by the trend, and trend persistence.
SIGNAL TO NOISE RATIO
One of the purposes of measuring the market cycle is to determine market
inefficiency because of a short-term coherence. If there is a coherence
in prices, we can expect that coherence to continue, at least for a short
while. We can identify this cycle component as the signal we are trying
to exploit. On the other hand, the market is composed of a large number
of traders with diverse objectives. If we are looking for a cycle period
on the order of a month, the daily fluctuation in price is noise that can
interfere with our signal. In this sense we can define the range of a given
price bar from low to high as noise. If the noise amplitude is equal to
the peak amplitude of the cycle, then we have the theoretical case displayed
in Figure 2.
...Continued in the April issue of Technical Analysis of STOCKS &
COMMODITIES
Excerpted from an article originally published in the April 2007
issue of Technical Analysis of
STOCKS & COMMODITIES magazine. All rights reserved. © Copyright
2007, Technical Analysis, Inc.
Return to April 2007 Contents