TRADESTATION: ADJUSTED RATE OF
CHANGE INDICATOR
Martti Luoma's and Jussi Nikkinen's article in this issue, "Two-Point
Problem Of The Rate Of Change," identifies a problem with traditional rate
of change calculations. As described by Luoma and Nikkinen, "A single change
in price produces two changes in the indicator, the latter usually not
being relevant." The following code translates their adjusted rate of change
formula into EasyLanguage.
To download this code, go to the Support Center at TradeStation.com.
Search for the file "Roc_Adj.Eld." TradeStation does not endorse or recommend
any particular strategy.
Indicator:  ROC_Adj
inputs:  Step( 5 ) ;
variables:  ROCAdj( 0 ) ;
ROCAdj = XAverage( RateOfChange( Close, 1 ), Step ) * Step ;
Plot1( ROCAdj, "ROCAdj" ) ;

FIGURE 1: TRADESTATION, ADJUSTED RATE OF CHANGE. This sample TradeStation
chart demonstrates Luoma and Nikkinen's adjusted rate of change indicator.
The blue-purple line displays the standard TradeStation rate of change
indicator; the red line is the adjusted calculation.
--Mark Mills
TradeStation Securities, Inc.
A subsidiary of TradeStation Group, Inc.
www.TradeStation.com
GO BACK
TRADESTATION: FRACTAL DIMENSION INDEX
Radha Panini's March 2007 S&C article "Using The Fractal Dimension
Index: Trading Systems And Fractals" builds on Erik Long's May 2003 S&C
article, "Making Sense Of Fractals." In the March 2007 article, Panini
shows how to use a fractal dimension index filter in three different trading
systems: a moving average crossover, a breakout, and an RSI-based system.

FIGURE 2: TRADESTATION, FRACTAL DIMENSION INDEX. Panini's
FDI filter is applied to three strategies in this sample TradeStation chart.
On the left is the moving average crossover system. In the middle is the
breakout system. On the right is the RSI system.
Here is the EasyLanguage code for all three of the author's strategies.
To download this code, go to the Support Center at TradeStation.com and
search for the file "Panini.Eld." TradeStation does not endorse or recommend
any particular strategy.
Strategy: Panini MA system
{ Based on Radha Panini's TASC March 2007 article,
"Trading Systems and Fractals". }
inputs:
    UseFDI( false ),
    FractalLength( 30 ),
    FDIThreshold( 1.5 ),
    FastLength( 20 ),
    SlowLength( 80 ) ;
variables:
    FractalDimIndex( 0 ),
    FastHighAverage( 0 ),
    SlowHighAverage( 0 ),
    FastLowAverage( 0 ),
    SlowLowAverage( 0 ) ;
FastHighAverage = Average( High, FastLength ) ;
SlowHighAverage = Average( High, SlowLength ) ;
FastLowAverage = Average( Low, FastLength ) ;
SlowLowAverage= Average( Low, SlowLength ) ;
FractalDimIndex = FDI( FractalLength ) ;
{ Enter long if all conditions are met:
1.)  today's close is above the FastLength day average of highs
2.)  today's close is above the SlowLength day average of highs
3.)  today's FastLength average of highs is above its value FastLength days ago
4.)  today's SlowLength average of highs is above its value SlowLength days ago
5.)  FractalDimIndex < FDIThreshold or UseFDI = false }
if Close > FastHighAverage
    and Close > SlowHighAverage
    and FastHighAverage > FastHighAverage[FastLength]
    and SlowHighAverage > SlowHighAverage[SlowLength]
    and ( FractalDimIndex < FDIThreshold or UseFDI =
     false )
then
    Buy next bar market ;
{ Enter short if all conditions are met:
1.)  today's close is below the FastLength day average of lows
2.)  today's close is below the SlowLength day average of lows
3.)  today's FastLength average of lows is below its value FastLength days ago
4.)  today's SlowLength average of lows is below its value SlowLength days ago
5.)  FractalDimIndex < FDIThreshold or UseFDI = false }
if Close < FastLowAverage
    and Close < SlowLowAverage
    and FastLowAverage < FastLowAverage[FastLength]
    and SlowLowAverage < SlowLowAverage[SlowLength]
    and ( FractalDimIndex < FDIThreshold or UseFDI =
     false )
then
    Sellshort next bar at market ;
{ Exit long trade if the close is below the SlowLength day MA of lows. }
if Close < SlowLowAverage then
    Sell next bar at market ;
{ Exit short trade if the close is above the SlowLength day MA of highs. }
if Close > SlowHighAverage then
    BuyToCover next bar market ;
Strategy: Panini Breakout
{ Based on Radha Panini's TASC March 2007 article,
"Trading Systems and Fractals". }
inputs:
    UseFDI( false ),
    FractalLength( 80 ),
    FDIThreshold( 1.5 ),
    Length( 20 ) ;
variables:
    FractalDimIndex( 0 ),
    HighestHigh( 0 ),
    LowestLow( 0 ) ;
HighestHigh = Highest( High, Length ) ;
LowestLow = Lowest( Low, Length ) ;
FractalDimIndex = FDI( FractalLength ) ;
{ Enter long if today's high is greater than the highest high in the last Length days and other
  conditions are met. }
if High > HighestHigh[1] then
    if ( FractalDimIndex < FDIThreshold or UseFDI =
     false ) then
        Buy next bar market
    else
        BuyToCover next bar market ;
{ Enter short if today's low is lower than the lowest low in the last Length days and other
  conditions are met. }
if Low < LowestLow[1] then
    if ( FractalDimIndex < FDIThreshold or UseFDi =
     false ) then
        Sellshort next bar at market
    else
        Sell next bar at market ;
Strategy: Panini RSI system
{ Based on Radha Panini's TASC March 2007 article,
"Trading Systems and Fractals". }
inputs:
    UseFDI( false ),
    FractalLength( 80 ),
    FDIThreshold( 1.5 ),
    Length( 14 ) ;
variables:
    FractalDimIndex( 0 ),
    RSIValue( 0 ) ;
RSIValue = RSI( Close, Length ) ;
FractalDimIndex = FDI( FractalLength ) ;
{ Enter short if the Length day RSI of close prices
rises above 65 and other conditions are met. }
if RSIValue crosses over 65 and ( FractalDimIndex >
 FDIThreshold or UseFDI = false ) then
    Sellshort next bar at market ;

{ Exit the short position if the Length day RSI of close
prices crosses below 35. }
if RSIValue crosses below 35 then
    BuyToCover next bar market ;
Function: FDI
{ Program to Calculate Fractal Dimension of Waveforms.
Based on code by Carlos Sevcik, "A Procedure to Estimate
the Fractal Dimension of Waveforms", see
https://www.csu.edu.au/ci/vol05/sevcik/sevcik.html .
Thanks to Alex Matulich for pointing out this article
https://unicorn.us.com/ }
inputs:
    N( numericsimple ) ;
variables:
     Diff( 0 ),
    Length( 0 ),
    PriceMax ( 0 ),
     PriceMin( 0 ),
    PriorDiff( 0 ),
    Iteration( 0 ),
    FractalDim( 0 ) ;
PriceMax = Highest( Close, N ) ;
PriceMin = Lowest( Close, N ) ;
Length = 0 ;
PriorDiff = 0 ;
for Iteration = 1 to N - 1
    begin
    if PriceMax - PriceMin > 0 then
        begin
        Diff = ( Close[Iteration] - PriceMin ) /
         ( PriceMax - PriceMin ) ;
        if Iteration > 1 and N <> 0 then
            Length = Length + SquareRoot( Square( Diff -
             PriorDiff ) + ( 1 / Square( N ) ) ) ;
        PriorDiff = Diff  ;
        end ;
    end ;
if Length > 0 and N <> 0 then
    FractalDim = 1 + ( log( Length )+ log( 2 ) ) / log( 2 * N )
else
    FractalDim = 0 ;
FDI =  FractalDim  ;
--Mark Mills
TradeStation Securities, Inc.
A subsidiary of TradeStation Group, Inc.
www.TradeStation.com
GO BACK
eSIGNAL: ADJUSTED RATE OF CHANGE INDICATOR
For the article "Two-Point Problem Of The Rate Of Change" by Martti
Luoma and Jussi Nikkinen in this issue, we've provided the formula "adjusted_ROC.efs"
for eSignal. One formula parameter may be configured through the Edit Studies
option in the Advanced Chart to change the periods used for the moving
average.
A sample eSignal chart implementation is in Figure 3.

FIGURE 3: eSIGNAL, ADJUSTED RATE OF CHANGE. Here is a demonstration
of Luoma's and Nikkinen's adjusted rate of change indicator in eSignal.
To discuss this study or download a complete copy of the formula,
please visit the EFS Library Discussion Board forum under the Bulletin
Boards link at www.esignalcentral.com. The eSignal formula scripts (EFS)
are also available for copying and pasting from the STOCKS & COMMODITIES
website at Traders.com.
/***************************************
Provided By : eSignal (c) Copyright 2007
Description:  Two-Point Problem of the Rate of Change
              by Martti Luoma and Jussi Nikkinen
Version 1.0  2/05/2007
Notes:
* April 2007 Issue of Stocks & Commodities Magazine
* Study requires version 8.0 or later.
Formula Parameters:         Default:
Periods                                 21
*****************************************************************/
function preMain() {
    setStudyTitle("Adjusted ROC ");
    setCursorLabelName("AdjROC", 0);
    setDefaultBarFgColor(Color.red, 0);
    setDefaultBarThickness(2, 0);

    var fp1 = new FunctionParameter("Periods", FunctionParameter.NUMBER);
        fp1.setName("Periods");
        fp1.setLowerLimit(1);
        fp1.setDefault(21);
}
// Global Variables
var bVersion  = null;    // Version flag
var bInit     = false;   // Initialization flag
var xAdjROC   = null;
function main(Periods) {
    if (bVersion == null) bVersion = verify();
    if (bVersion == false) return;
    //Initialization
    if (bInit == false) {
        xAdjROC = efsInternal("calcAdjROC", Periods);
        bInit = true;
    }
    return xAdjROC.getValue(0);
}
// AdjROC globals
var xEMA = null;
function calcAdjROC(nP) {
    if (bInit == false) {
        xEMA = ema(nP, roc(1));
        bInit = true;
    }

    var nEMA = xEMA.getValue(0);
    if (nEMA == null) return;

    return (nEMA * nP);
}
function verify() {
    var b = false;
    if (getBuildNumber() < 779) {
        drawTextAbsolute(5, 35, "This study requires version 8.0 or later.",
            Color.white, Color.blue, Text.RELATIVETOBOTTOM|Text.RELATIVETOLEFT|Text.BOLD|Text.LEFT,
            null, 13, "error");
        drawTextAbsolute(5, 20, "Click HERE to upgrade.@URL=https://www.esignal.com/download/default.asp",
            Color.white, Color.blue, Text.RELATIVETOBOTTOM|Text.RELATIVETOLEFT|Text.BOLD|Text.LEFT,
            null, 13, "upgrade");
        return b;
    } else {
        b = true;
    }

    return b;
}
--Jason Keck
eSignal, a division of Interactive Data Corp.
800 815-8256, www.esignalcentral.com
GO BACK
WEALTH-LAB: ADJUSTED RATE OF CHANGE INDICATOR
An exponential smoothing that adds information to an indicator, rather
than just removing noise? Smoothing by adding? As strange as it may appear,
it's a simple yet effective idea.
In this issue, Martti Luoma and Jussi Nikkinen present their version
of the rate of change indicator in "Two-Point Problem Of The Rate Of Change."
In order to compare this "adjusted ROC" against the standard rate of change
indicator, we wrote a simple ChartScript that simulates trading the spread
of two ROCs between a stock and a broad market index. (See code for actual
rules.) The performance of this strategy improves markedly just by changing
the simple ROC implementation to Luoma's and Nikkinen's new adjusted version,
even without other modifications! (See Figures 4 and 5.)

FIGURE 4: WEALTH-LAB, RATE OF CHANGE. Here are sample results
of a 10-year historical simulation using the original script (with UseAdjustedROC
= false), trading all 30 stocks from the Dow Jones Industrial Average (Dow
30), allocating 10% of equity to each new position, starting with $100,000.

FIGURE 5: WEALTH-LAB, ADJUSTED RATE OF CHANGE. Here are sample results
of a 10-year historical simulation after setting UseAdjustedROC to "true,"
settings as above.
WealthScript code for Adjusted Rate of Change
const Period = 40;
const UseAdjustedROC = true;
// get a broad market index (S&P500 is used here) and its ROC data
var sIndex: integer = GetExternalSeries( '.SPX', #Close );
var sIndexROC: integer = ROCSeries( sIndex, Period );
// get the ROC of selected stock
var sROC: integer = ROCSeries( #Close, Period );
if UseAdjustedROC then
begin
  // change from standard ROCs to the "adjusted" version
  sROC := EMASeries( ROCSeries( #Close, 1 ), Period );
  sIndexROC := EMASeries( ROCSeries( sIndex,  1), Period );
end;
// compute the spread between the two (adjusted) ROCs
// that is, the difference:  ROC(stock) - ROC(index)
var sSpread: integer = SubtractSeries( sROC, sIndexROC );
var Bar: integer;
for Bar := Period to BarCount - 1 do
begin
  var R: float = GetSeriesValue( Bar, sROC );
  if LastPositionActive then
  begin
    // exit all (long) positions when a profit target is reached,
    // or when the stock rises while the spread starts decreasing
    if ( PositionOpenProfitPct( Bar, LastPosition ) > 4 )
    or ( ( R > 0 )  and  TurnDown( Bar, sSpread ) ) then
      SellAtMarket( Bar + 1, #All, '' );
  end;
  // enter a new long position after the stock had a dip,
  // as soon as the spread shows an improvement
  if ( R < 0 )  and  TurnUp( Bar, sSpread ) then
    if BuyAtMarket( Bar + 1, FloatToStr( -R ) ) then
      // when trading multiple stocks, and not having enough cash to
      // enter all alerts, instruct WL's $imulator to trade those with
      // the lowest (most negative) ROC value, hoping in a faster bounce
      SetPositionPriority( LastPosition, -R );
end;
HideVolume;
EnableTradeNotes(false, true, false);
var Pane: integer = CreatePane( 100, false, true );
DrawHorzLine( 0, Pane, #Black, #Thick );
PlotSeriesLabel( sROC, Pane, #Red, #Thin, 'sROC' );
PlotSeriesLabel( sIndexROC, Pane, #Blue, #Dotted, 'sIndexROC' );
PlotSeriesLabel( sSpread, Pane, #Green, #Thick, 'sSpread' );
-- Giorgio Beltrame
www.wealth-lab.com
GO BACK
AMIBROKER: ADJUSTED RATE OF CHANGE INDICATOR
In their article "Two-Point Problem Of The Rate Of Change" in this issue,
Martti Luoma and Jussi Nikkinen present a modification of the classic ROC
indicator. This can be constructed in one of two ways in AmiBroker.
The first does not require writing any code. You can reconstruct Luoma's
and Nikkinen's Rocadj or other indicators using AmiBroker's drag-and-drop
technology. To recreate the Rocadj, select the Chart tab, go to the Indicators
folder, and doubleclick on the ROC. This will create a new chart pane containing
the ROC. Then go to the Averages folder and click and drag EMA onto an
ROC chart. Your indicator is now ready. Simply adjust the ROC period to
1 and the EMA smoothing period to 21 using the Parameters window.

FIGURE 6: AMIBROKER, ADJUSTED RATE OF CHANGE INDICATOR.
A price chart of the NASDAQ 100 index is shown in the upper pane with a
21-day ROCadj (red line). The standard ROC (blue line) is shown in the
lower pane. The divergence between ROCadj and the price chart is marked
as described in Luoma's and Nikkinen's article in this issue.
The second way to reconstruct Luoma's and Nikkinen's ROCadj indicator is
to use the formula code presented here. Paste it into the Formula Editor
and press the "Insert chart" button.
AmiBroker code for ROCadj indicator
periods = Param("Periods", 21, 2, 200, 1 );
ROCadj = periods * EMA( ROC( C, 1 ), periods );
Plot( ROCadj, "ROCadj "+periods, colorRed, styleThick );
// the line below adds standard ROC overlay
Plot( ROC( C, periods ), "ROC "+periods, colorBlue );
This code can be copied from the STOCKS & COMMODITIES website
at www.Traders.com. A sample chart is in Figure 6.
--Tomasz Janeczko, AmiBroker.com
www.amibroker.com
GO BACK
NEUROSHELL TRADER: ADJUSTED RATE OF CHANGE
INDICATOR
The adjusted rate of change indicator described by Martti Luoma and
Jussi Nikkinen in their article in this issue can be easily implemented
in NeuroShell Trader by combining a few of the NeuroShell Trader's 800+
indicators. To implement the indicator, select "New Indicator …" from the
Insert menu and use the Indicator Wizard to set up the following indicator:
Multiply2 ( ExpAvg ( %Change ( Close, 1 ), 21, 21 )
A sample chart implementing the Rocadj is shown in Figure 7. For more information
on NeuroShell Trader,
visit www.NeuroShell.com.

FIGURE 7: NEUROSHELL, STANDARD ROC VS. ADJUSTED ROC. These
sample NeuroShell plots show both the 21-period adjusted ROC and the standard
21-period ROC indicators in the lower pane. The blue line is the adjusted
ROC.
--Marge Sherald, Ward Systems Group, Inc.
301 662-7950, sales@wardsystems.com
www.neuroshell.com
GO BACK
WORDEN'S MODULAR TOOLS: ADJUSTED RATE OF
CHANGE INDICATOR
Note from Worden: To run the tool described here, you will need the
free Blocks Player from The Blocks Company. You can download the player
at www.blocks.com/player.
For the article by Martti Luoma and Jussi Nikkinen in this issue, "Two-Point
Problem Of The Rate Of Change," we've created a modular chart tool that
runs in the Blocks Player. To run it, open the Personal Chartist workspace
in the Blocks Player and click the Start button. Click the Web Library
tab, then double-click on the Worden folder. Double-click the S&C Traders'
Tips folder and double-click "Adjusted rate of change."
The tool contains a price graph in the top pane and both the rate of
change and adjusted rate of change in the lower pane so you can easily
see the difference between the two lines.

FIGURE 8: WORDEN, STANDARD ROC VS. ADJUSTED ROC. A price
graph in the top pane and both the rate of change and adjusted rate of
change in the lower pane lets you easily see the difference between the
two lines (adjusted is in red).
You can access the QuickEdit menu by clicking on "Roc (% Adj)" in
the legend. Here you can change the period for the adjusted rate of change
calculation and the color of the indicator.
No code or cutting and pasting is required to use this tool. To see
how we've built the adjusted rate of change, double-click on "Roc (% Adj)"
in the legend. This will open its block diagram so you can review (and
edit) its logic.
To discuss this tool, please visit the Discussion Forum at Tools.Worden.com.
Our online trainers will be happy to assist you.
--Patrick Argo and Bruce Loebrich
Worden Brothers, Inc.
800 776-4940, www.worden.com
GO BACK
NEOTICKER: ADJUSTED RATE OF CHANGE INDICATOR
The adjusted rate of change indicator described by Martti Luoma and
Jussi Nikkinen in this issue in their article, "Two-Point Problem Of The
Rate Of Change," can be written in NeoTicker formula language.
First, create a formula language indicator and name it "Tasc Adjusted
Rate of Change" (Listing 1). It has one integer parameter for smoothing
periods. This indicator has one plot that shows the values for the adjusted
rate of change.
An adjusted rate of change can also be calculated in NeoTicker without
writing any code by taking advantage of NeoTicker's ability to add indicators
to indicators. To do this on a chart, add the built-in rate of change indicator,
then add a moving average and set the source link to "rate of change" instead
of "data series." The result is exactly the same as the indicator implemented
using the formula language (see Figure 9 for a sample implementation).

FIGURE 9: NEOTICKER, ADJUSTED RATE OF CHANGE. The bottom
pane is the adjusted ROC.
LISTING 1: NeoTicker formula language for
adjusted rate of change (Rocadj)
plot1 := mov(roc(data1, 1), "Exponential", param1);
A downloadable version of the adjusted rate of change and an exported
group package that shows the chart will be available from the NeoTicker
blog site (https://blog.neoticker.com).
--Kenneth Yuen, TickQuest Inc.
www.tickquest.com
GO BACK
AIQ: ADJUSTED RATE OF CHANGE INDICATOR
The AIQ code for Martti Luoma's and Jussi Nikkinen's adjusted rate of
change indicator ("Two-Point Problem Of The Rate Of Change") is given here.
The authors present a case for the adjusted rate of change indicator
(Rocadj) as an improvement over the traditional two-point rate of change
indicator (ROC). They make some excellent points but they do not attempt
to use the indicator in a trading system to see whether it will outperform
the traditional indicator. I decided to give this a try by devising the
following trading system:
Enter a long position if:
1) The 20-day ROC (or Rocadj) is positive today and
yesterday it was negative
2) The five-day linear regression slope of the 50-day
simple moving average of the NASDAQ 100 index is greater than zero, indicating
an uptrend
3) Use the ROC (or Rocadj) as a sorting indicator,
descending, to select which signals to take each day
4) Put 20% of the capital allocated to the system
into each trade, taking no more than two trades per day, and hold no more
than five total positions at any one time.
Exit all long positions after three trading days.
I initially reversed the rules for the short sale tests, but after
some tests, the short side worked so poorly that I changed the parameters
and added a few more rules. However, the short side still did not work
over the test period.
To test the effectiveness of the Rocadj, I ran two tests for longs and
two tests for the shorts using the AIQ Portfolio Simulator and the NASDAQ
100 list of stocks over the test period 9/1/2000 to 2/6/2007. One test
was run with the ROC indicator and the other was run with the Rocadj indicator.
Figure 10, which compares the resulting equity curves of the two tests
on the longs, shows that the traditional ROC indicator works better in
the context of this trading system. Figure 11, which compares the resulting
equity curves of the two tests on the shorts, shows that the traditional
ROC indicator also works better in the context of this trading system.
Both of the short-side systems have negative returns over the test period.
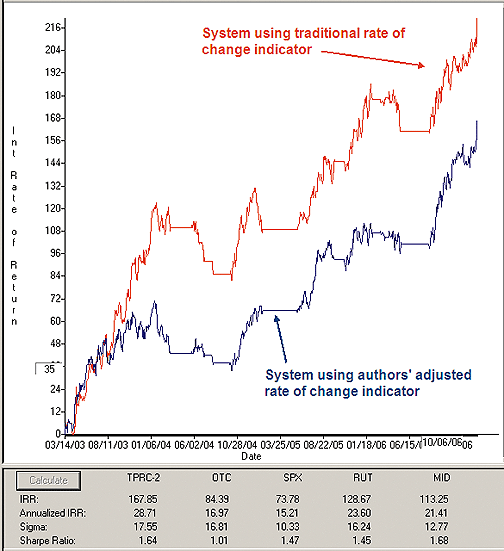
FIGURE 10: AIQ, STANDARD ROC VS. ADJUSTED ROC, LONG SIDE.
Here is a comparison of equity curves for the ROC versus the ROCadj for
longs.
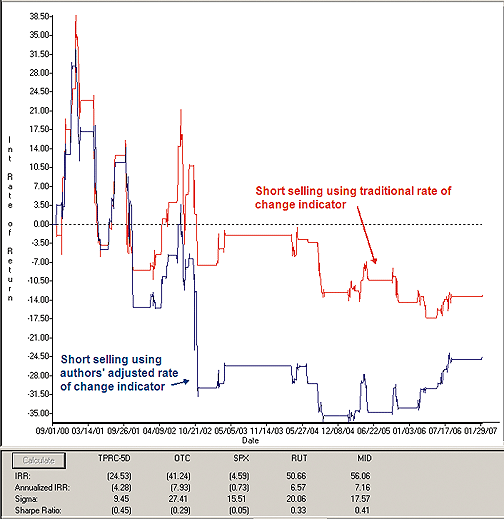
FIGURE 11: AIQ, STANDARD ROC VS. ADJUSTED ROC, SHORT SIDE. Here is
a comparison of equity curves for the ROC versus the ROCadj for shorts.
The AIQ code for the Rocadj indicator can be downloaded from
the AIQ website at https://www.aiqsystems.com/S&C1.htm. The code, writeup,
and graphs are also posted here: https://www.tradersedgesystems.com/traderstips.htm.
!! TWO-POINT RATE OF CHANGE, TASC April 2007
! Authors: Martti Luoma & Jussi Nikkinen
! Coded by: Richard Denning 02/05/07
! TRADITIONAL RATE OF CHANGE INDICATORS:
Pr is [close].
ROC1     is (Pr / valresult(Pr,1) - 1) * 100.
ROC20     is (Pr / valresult(Pr,20) - 1) * 100.
ROCn     is (Pr / valresult(Pr,N) - 1) * 100.
ROCn2     is (Pr / valresult(Pr,N2) - 1) * 100.
! ADJUSTED RATE OF CHANGE INDICATOR:
N     is 20.
N2     is 5.
ROCadj     is expavg(ROC1,N) * N.
ROCadj2     is expavg(ROC1,N2) * N2.
! TRADING SYSTEMS USING ROC AND ROCadj:
! LONG ENTRY AND EXIT RULES:
PD is {position days}.
LE1 if ROCn > 0 and valrule(ROCn < 0,1)
   and TickerRule("NDX",slope2(simpleavg(Pr,50),5) > 0).
LX1 if PD >=3 .
LE2 if ROCadj > 0 and valrule(ROCadj < 0,1)
   and TickerRule("NDX",slope2(simpleavg(Pr,50),5) > 0).
LX2 if PD >=3.
! SHORT SALE ENTRY AND EXIT RULES:
SE1 if ROCn2 < 0 and valrule(ROCn2 > 0,1) and ROCn < 0 and
  TickerRule("NDX",slope2(simpleavg(Pr,50),5) < 0 and slope2(Pr,10)>0).
SX1 if PD >=3.
SE2 if ROCadj2 < 0 and valrule(ROCadj2 > 0,1) and ROCadj < 0 and
  TickerRule("NDX",slope2(simpleavg(Pr,50),5) < 0 and slope2(Pr,10)>0).
SX2 if PD >=3.
--Richard Denning, AIQ Systems
richard.denning@earthlink.net
GO BACK
STRATASEARCH: ADJUSTED RATE OF CHANGE INDICATOR
Authors Martti Luoma and Jussi Nikkinen have done an excellent job of
pointing out the weaknesses of the commonly used rate of change (ROC) indicator
in their article in this issue, "Two-Point Problem Of The Rate Of Change,"
and in showing how it can be greatly improved. It should be noted, however,
that any alteration to an indicator may also alter the conditions under
which that indicator works best.
In our testing of the old and new versions of the ROC, we ran several
thousand permutations of each, with each version run alongside a wide variety
of supporting rules. What we discovered was that the adjusted ROC version
appeared to perform best when used in systems with much shorter holding
periods, while the original ROC performed best when used in systems with
longer holding periods. This faster response time makes sense, considering
the exponential average smoothing placed in the new version. But this difference
also lets us know that the two versions may not always be interchangeable,
and the new version may not be the best choice in all cases.
//****************************************************************
// Adjusted Rate Of Change Indicator
//****************************************************************
price = parameter("Price");
periods = parameter("Periods");
ROCadj = mov(proc(price, 1), periods, exponential);
A sample StrataSearch chart is shown in Figure 12.
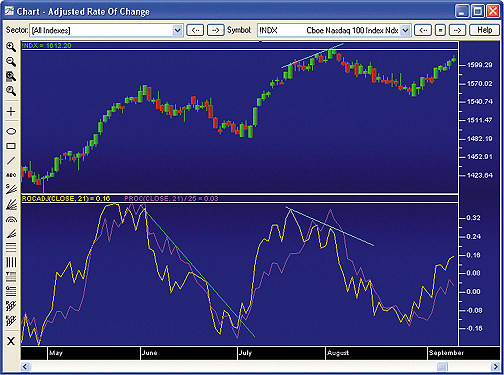
FIGURE 12: STRATASEARCH, ADJUSTED RATE OF CHANGE. The green
line identifies how the adjusted rate of change can help signal a breakout.
The two blue lines show a divergence, which often shows an impending reversal.
As with all our StrataSearch Traders' Tips contributions, additional
information -- including plug-ins -- can be found in the Shared Area of our
user forum. This month's plug-in also contains a number of prebuilt trading
rules that will allow you to include this system in your automated searches
and see for yourself what it can do. Simply install the plug-in and launch
your automated search.
--Pete Rast, Avarin Systems, Inc.
www.StrataSearch.com
GO BACK
BIOCOMP DAKOTA WITH SWARM TECHNOLOGY: ADJUSTED
RATE OF CHANGE INDICATOR
In this month's issue, Martti Luoma and Jussi Nikkinen show us how to
smooth the rate of change using an exponential moving average and compare
the smoothed and raw for convergence/divergence. The code in BioComp Dakota
to do this is quite simple. First, we calculate the rate of change using
their method:
ROC(PriceCtr) = ((Price(CurrentBar) - Price(CurrentBar - ParameterValue(1)))
                / Price (CurrentBar - ParameterValue(1))) * 100
Then we smooth it with a swarm-adapted XMA to create their "Rocadj":
ROCadj = Dakota.XMA(ROC,ParameterValue(1))
Figure 13 shows the ROC and Rocadj on the S&P 500 futures.
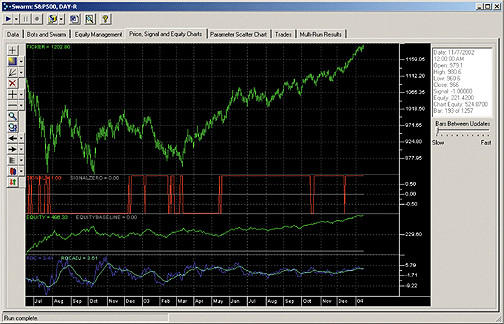
FIGURE 13: BIOCOMP DAKOTA, ROC VS. ADJUSTED ROC. Here is a demonstration
of the ROC and ROCadj indicator on S&P 500 futures data from Pinnacle
Data.
--Carl Cook, BioComp Systems, Inc.
https://www.biocompsystems.com/products/Dakota/
952 746-5761
GO BACK
TRADECISION: ADJUSTED RATE OF CHANGE INDICATOR
In their article "Two-Point Problem Of The Rate Of Change," Martti Luoma
and Jussi Nikkinen demonstrate the advantages of the Rocadj indicator in
that is devoid of many undesirable properties of the classic ROC indicator.
They consider it to be more useful than the standard ROC mainly because
of its predictive properties.
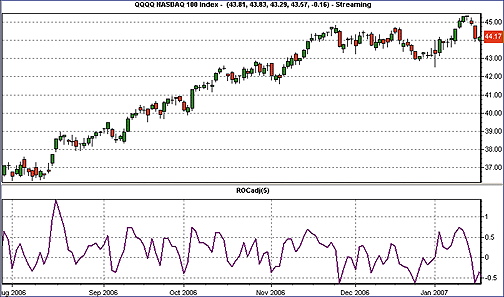
FIGURE 14: TRADECISION, ADJUSTED RATE OF CHANGE. Use the
ROCadj indicator to identify the possible divergences between the indicator
and price movement.
The Indicator Builder in Tradecision enables you to create the adjusted
rate of change indicator:
input
   Period:"Period",5;
end_input
return EMA(RoC(C,1,PERCENT),Period);
To use this indicator in Tradecision, visit the area "Traders' Tips
from Tasc magazine" at https://tradecision.com/support/tasc_tips/tasc_traders_tips.htm
or copy the code from the STOCKS & COMMODITIES website at www.Traders.com.
--Alex Grechanowski
Alyuda Research, Inc.
sales@tradecision.com, (510) 931-7808
www.alyuda.com, www.tradecision.com
GO BACK
TRADING SOLUTIONS: ADJUSTED RATE OF CHANGE
INDICATOR
In the article "Two-Point Problem Of The Rate Of Change," Martti Luoma
and Jussi Nikkinen introduce a smoothed version of the rate of change indicator.
This function can be entered into TradingSolutions as described here.
It is also available as a function file that can be downloaded from the
TradingSolutions website (www.tradingsolutions.com) in the Solution Library
section.
Function: Adjusted Rate of change
Inputs: Close, Period
EMA (ROC (Close, 1, 1), Period)
--Gary Geniesse
NeuroDimension, Inc.
800 634-3327, 352 377-5144
www.tradingsolutions.com
GO BACK
OMNITRADER:ADJUSTED RATE OF CHANGE INDICATOR
For this month's Traders' Tip for Martti Luoma's and Jussi Nikkinen's
article in this issue, "Two-Point Problem Of The Rate Of Change," we have
replicated the adjusted rate of change indicator (RocAdj) in OmniTrader.
This indicator addresses some of the shortcomings found in the traditional
rate of change calculation; in particular, it provides an elegant solution
to the two-point problem. In Figure 15, the large gap in AAPL on April
15 easily confuses the traditional ROC, but by taking into account all
the data within the calculation range, the adjusted ROC is able to accurately
reflect the price data.
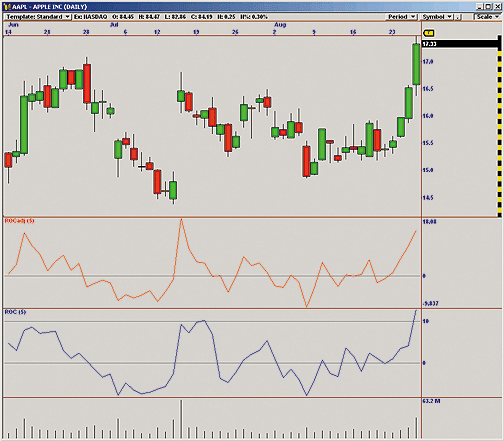
FIGURE 15: OMNITRADER, ADJUSTED RATE OF CHANGE. This shows
the reaction of the adjusted rate of change (top) compared to the traditional
rate of change (bottom) to the gap in AAPL on July 15, 2004.
To use the indicator, first copy the file RocAdj.txt to the directory
C:\Program Files\Nirvana\OT2007\VBA\Indicators. Next open OmniTrader and
click Edit:OmniLanguage. You should see RocAdj in the Project Pane. Now
simply click Compile, and the code is ready to use. For more information
and complete source code, visit www.omnitrader.com/ProSI.
#Indicator
'**************************************************************
'*   Rate of Change Adjusted (ROCAdj.txt)
'*     by Jeremy Williams
'*       Feb.6,2007
'*
'*    Adapted from Technical Analysis of Stocks & Commodities
'*     April 2007
'*
'*  Summary:
'*
'*      This indicator addresses some of the shortcomings of the
'*  traditional Rate of Change calculation. In particular all data
'*  within the calculation range is analyzed, providing an elegant
'*  solution to the "Two Point Problem" of the classical calculation.
'*  For more information see "Two Point Problem Of The Rate Of Change"
'*  in the April 2007 issue of Technical Analysis of Stocks & Commodities
'*
'*  Parameters:
'*
'*  Periods -  Specifies the number of periods used for the calculation.
'*
'**************************************************************
#Param "Periods",5
Dim myROC        As Single
Dim myEMA        As Single
Dim myROCAdj    As Single
' Calculatate the indicator
myROC = ROC(1)
myEMA = EMA(myRoc,Periods)
myROCAdj = myEMA*Periods
' Plot the indicator values
Plot("ROCAdj",myROCAdj)
' Return the value calculated by the indicator
Return myROCAdj
--Jeremy Williams, Trading Systems Researcher
Nirvana Systems, Inc.
www.omnitrader.com
GO BACK
VT TRADER:ADJUSTED RATE OF CHANGE INDICATOR
Martti Luoma's and Jussi Nikkinen's article in this issue, "Two-Point
Problem Of The Rate Of Change," discusses the very popular rate of change
(ROC) indicator and its shortcomings. According to Luoma and Nikkinen,
the ROC indicator suffers from a lack of natural smoothing, loss of important
relevant information, and the misinterpretation of information.
As a solution to these issues, they introduce their adjusted rate of
change (Rocadj) indicator. While the Rocadj can be used in the same ways
as the original ROC indicator, its predictive properties serve its main
purpose, which is to help the trader better identify possible divergences
between the Rocadj and the underlying price movement.
We'll be offering the Rocadj indicator for download in our user forums.
The VT Trader code and instructions for creating the Rocadj indicator are
as follows (input variables are parameterized to allow customization):
Adjusted Rate of Change (ROCadj) Indicator
1. Navigator Window>Tools>Indicator Builder>[New] button
2. In the Indicator Bookmark, type the following text for each field:
Name: TASC - 04/2007 - Adjusted Rate of Change (ROCadj)
Short Name: vt_ROCadj
Label Mask: Adjusted Rate of Change (ROCadj) (%Pr%, %tPr%)
Placement: New Frame
Inspect Alias: Adjusted Rate of Change
3. In the Input Bookmark, create the following variables:
[New] button... Name: Pr , Display Name: Price , Type: price , Default: Close
[New] button... Name: tPr , Display Name: Smoothing Periods , Type: integer , Default: 20
4. In the Output Bookmark, create the following variables:
[New] button...
Var Name: ROCadj
Name: (ROCadj)
Line Color: pink
Line Width: slightly thicker
Line Type: solid line
5. In the Horizontal Line Bookmark, create the following lines:
[New] button...
Value: +0.0000
Color: black
Width: thin line
Type: dashed line
6. In the Formula Bookmark, copy and paste the following formula:
{Provided By: Visual Trading Systems, LLC & Capital Market Services, LLC (c) Copyright 2007}
{Description: Adjusted Rate of Change (ROCadj) indicator; Logic by Martti Luoma & Jussi Nikkinen}
{Notes: April 2007 Issue - Two-Point Problem of the Rate of Change}
{vt_ROCadj Version 1.0}
ROCadj:= mov(ROC(Pr,1,Percent),tPr,E);
7. Click the "Save" icon to finish building the Adjusted Rate of Change indicator.
To attach the Rocadj indicator to a chart (Figure 16), click the
right-mouse button within the chart window and then select "Add Indicators"
-> "TASC - 04/2007 - Adjusted Rate of Change (ROCadj)" from the indicator
list.
To learn more about VT Trader, visit www.cmsfx.com.
--Chris Skidmore
Visual Trading Systems, LLC (courtesy of CMS Forex)
(866) 51-CMSFX, trading@cmsfx.com
www.cmsfx.com
GO BACK
VT TRADER: FRACTAL DIMENSION INDEX
"Using The Fractal Dimension Index: Trading Systems And Fractals," which
appeared in the March 2007 issue of STOCKS & COMMODITIES, discusses
the benefits of applying fractal analysis to a few well-known trading systems.
Panini focuses primarily on an indicator called the fractal dimension index
(FDI), which is applied as a filter for the trade entries generated by
the sample trading systems. The FDI is used to measure the fractal dimension
of a price series. Typically, its values range between 1 and 2. In the
article, 1.5 is the level used to filter trade entries. FDI values above
1.5 indicate that the market is trading in a range while values below 1.5
indicate that the market is trending.
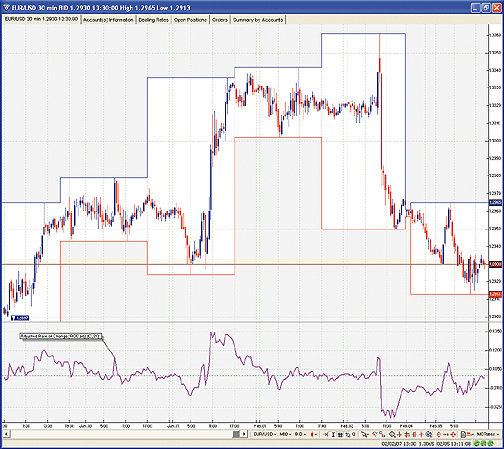
FIGURE 16: VT TRADER, ADJUSTED RATE OF CHANGE. The TOCadj (purple
line) is displayed in its own frame below a EUR/USD 30-minute candlestick
chart.
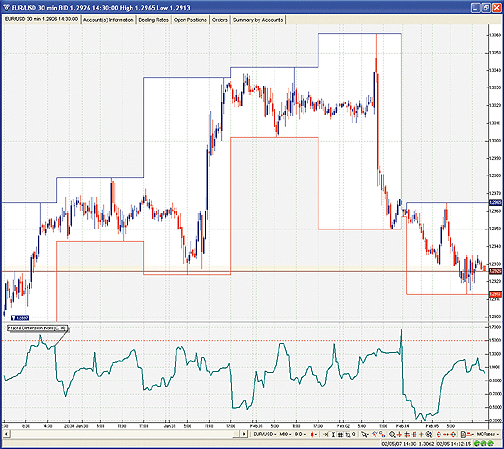
FIGURE 17: VT TRADER, FRACTAL DIMENSION INDEX
We'll be offering the fractal dimension index for download in our user
forums. The VT Trader code and instructions for recreating the FDI indicator
are as follows (input variables are parameterized to allow customization):
Fractal Dimension Index (FDI) Indicator
1. Navigator Window>Tools>Indicator Builder>[New] button
2. In the Indicator Bookmark, type the following text for each field:
Name: TASC - 04/2007 (EXTRA) - Fractal Dimension Index
Short Name: vt_FDI
Label Mask: Fractal Dimension Index (%price%, %periods%)
Placement: New Frame
Inspect Alias: Fractal Dimension Index
3. In the Input Bookmark, create the following variables:
[New] button... Name: price , Display Name: Price , Type: price , Default: Close
[New] button... Name: periods , Display Name: Periods , Type: integer , Default: 100
4. In the Output Bookmark, create the following variables:
[New] button...
Var Name: FDI
Name: (FDI)
Line Color: dark green
Line Width: slightly thicker
Line Type: solid line
5. In the Horizontal Line Bookmark, create the following lines:
[New] button...
Value: +1.5000
Color: red
Width: thin line
Type: dashed line
6. In the Formula Bookmark, copy and paste the following formula:
{Provided By: Visual Trading Systems, LLC & Capital Market Services, LLC (c) Copyright 2007}
{Description: Fractal Dimension Index (FDI)}
{Notes: March 2007 Issue - Using the Fractal Dimension Index - Trading Systems and Fractals
   by Radha Panini}
{vt_FDI Version 1.0}
Ri:= log(price/Ref(price,-1));
Mn:= sum(ri,periods)/periods;
X:= sum((Ri-Mn),periods);
Rn:= hhv(X,periods) - llv(X,periods);
Sn:= stdev(Ri,periods);
Hurst:= log(Rn/Sn) / log(periods/2);
FDI:= 2 - Hurst;
7. Click the "Save" icon to finish building the Fractal Dimension Index indicator.
To attach the Fdi indicator to a chart (Figure 17), click the right-mouse button within the
   chart window and select "Add Indicators" -> "TASC - 04/2007 (EXTRA) - Fractal Dimension
   Index" from the indicator list.
-- Matvei Vasetsov & Chris Skidmore
Visual Trading Systems, LLC (courtesy of CMS Forex)
(866) 51-CMSFX, trading@cmsfx.com
GO BACK
TRADE NAVIGATOR/TRADEFENSE: ADJUSTED RATE
OF CHANGE
In Trade Navigator Gold and Platinum versions, you can create custom
functions to display on the chart as indicators. In this way, you can add
your own indicators to the ones already provided in Trade Navigator. You
can also add indicators from other traders or from magazine articles or
books.
To chart the adjusted rate of change indicator as described by Martti
Luoma and Jussi Nikkinen in their article in this issue ("Two-Point Problem
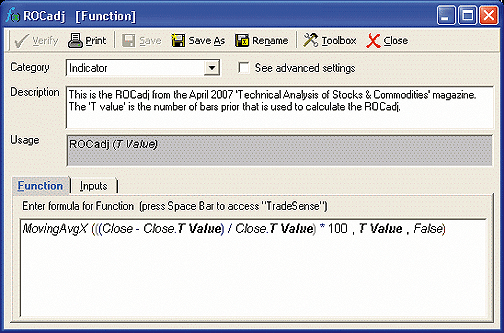
Of The Rate Of Change"), create a TradeSense function and label it "Rocadj."
Follow these steps:
Adjusted rate of change
1) Go to the Edit menu and click on Functions. This will bring up the Trader's Toolbox already set
   to the Functions tab.
2) Click on the New button.
3) Type the formula MovingAvgX (((Close - Close.T Value) / Close.T Value) * 100 , T Value , False)
   into the Function window:
By setting T value as an input, you can change the default number later to customize the number of
   bars used in the function.
4) Click on the Verify button. A message will pop up saying that T value is not recognized as an
   existing function or input. Click the Add button then double-click on the number in the Default
   Value field and change it to 7.
5) Click on the Save button, type in Rocadj as the name for the function and then click the OK button.
6) Close the New Function window.
Adding the indicator to your chart
You can add your new adjusted rate of change indicator to the chart
by clicking on the chart, typing "A," selecting the Indicators tab, selecting
the Rocadj indicator from the list, then clicking the Add button. You may
then move the indicator to the desired pane by clicking and dragging the
indicator's label into that pane.
To change the number of bars used for this indicator, simply click on
the chart that you have added them to, type the letter E on your keyboard,
select the indicator from the list, click the Value field next to T value
on the right side of the window and type the new number of bars to use
in the average.
We have created a file that can be downloaded through Trade Navigator
that will add the Rocadj indicator to Trade Navigator for you. Simply download
the file "SC0407" using your Trade Navigator and follow the upgrade prompts.
--Ryan Millard, Genesis Financial Technologies
www.GenesisFT.com
GO BACK
Return to April 2007 Contents
Originally published in the April 2007 issue of Technical Analysis
of STOCKS & COMMODITIES magazine. All rights reserved. © Copyright
2007, Technical Analysis, Inc.
![]() METASTOCK
METASTOCK
![]() TRADESTATION:
ADJUSTED RATE OF CHANGE INDICATOR
TRADESTATION:
ADJUSTED RATE OF CHANGE INDICATOR
![]() TRADESTATION:
FRACTAL DIMENSION INDEX
TRADESTATION:
FRACTAL DIMENSION INDEX
![]() eSIGNAL:
ADJUSTED RATE OF CHANGE INDICATOR
eSIGNAL:
ADJUSTED RATE OF CHANGE INDICATOR
![]() WEALTH-LAB:
ADJUSTED RATE OF CHANGE INDICATOR
WEALTH-LAB:
ADJUSTED RATE OF CHANGE INDICATOR
![]() AMIBROKER:
ADJUSTED RATE OF CHANGE INDICATOR
AMIBROKER:
ADJUSTED RATE OF CHANGE INDICATOR
![]() NEUROSHELL
TRADER: ADJUSTED RATE OF CHANGE INDICATOR
NEUROSHELL
TRADER: ADJUSTED RATE OF CHANGE INDICATOR
![]() WORDEN'S
MODULAR TOOLS: ADJUSTED RATE OF CHANGE INDICATOR
WORDEN'S
MODULAR TOOLS: ADJUSTED RATE OF CHANGE INDICATOR
![]() NEOTICKER:
ADJUSTED RATE OF CHANGE INDICATOR
NEOTICKER:
ADJUSTED RATE OF CHANGE INDICATOR
![]() AIQ:
ADJUSTED RATE OF CHANGE INDICATOR
AIQ:
ADJUSTED RATE OF CHANGE INDICATOR
![]() STRATASEARCH:
ADJUSTED RATE OF CHANGE INDICATOR
STRATASEARCH:
ADJUSTED RATE OF CHANGE INDICATOR
![]() BIOCOMP
DAKOTA WITH SWARM TECHNOLOGY: ADJUSTED RATE OF CHANGE INDICATOR
BIOCOMP
DAKOTA WITH SWARM TECHNOLOGY: ADJUSTED RATE OF CHANGE INDICATOR
![]() TRADECISION:
ADJUSTED RATE OF CHANGE INDICATOR
TRADECISION:
ADJUSTED RATE OF CHANGE INDICATOR
![]() TRADING
SOLUTIONS: ADJUSTED RATE OF CHANGE INDICATOR
TRADING
SOLUTIONS: ADJUSTED RATE OF CHANGE INDICATOR
![]() OMNITRADER:ADJUSTED
RATE OF CHANGE INDICATOR
OMNITRADER:ADJUSTED
RATE OF CHANGE INDICATOR
![]() VT
TRADER:ADJUSTED RATE OF CHANGE INDICATOR
VT
TRADER:ADJUSTED RATE OF CHANGE INDICATOR
![]() VT
TRADER: FRACTAL DIMENSION INDEX
VT
TRADER: FRACTAL DIMENSION INDEX
![]() TRADE
NAVIGATOR/TRADEFENSE: ADJUSTED RATE OF CHANGE
TRADE
NAVIGATOR/TRADEFENSE: ADJUSTED RATE OF CHANGE


