Trading Trendline Breaks, Part 2
Trendlines are common technical analysis charting tools, but there are a number of ways to implement them in your trading. Here's an in-depth look at trendlines.
Previously,
I discussed how trendlines are plotted, emphasizing that logarithmic trendlines
are more effective than linear ones. This time, I'll discuss how to trade
breaks in trendlines as well as the system I apply to my trading.

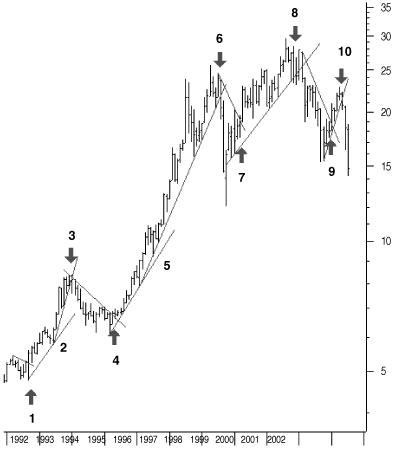
FIGURE 1: LONG-TERM TRENDLINES. On this monthly chart you can see how a long-term investor can act on a number of trendlines.
A long-term investor using monthly data could act upon a number of trendlines
in Figure 1. Assuming you can trade this stock both long and short:
1. At the end of 1992 the closing price breaks through the downtrend line. This is a buy signal.2. After a first reaction, the price moves up again during the second half of 1993. This is a clear second pivot point for drawing a longer-term uptrend line. Note from this point on that the price is accelerating and with time, moving farther away from the uptrend line. The best thing to do when this kind of move develops is to follow the new move with a new trendline, as shown.
3. Beginning in 1994 the price drops below the uptrend line. It's time to close the long position and open a short one. The idea is to buy the stock back at a later date for a lower price so you can make a profit.
4. In the second quarter of 1995, the price rises above the downtrend line. This is a signal to close the short position and open a new long one.
5. Note that at a certain point in time, the price moves farther away from the trendline again. You can start a new, sharper-moving uptrend line.
6. In the third quarter of 1998, the prices drop below the uptrend line. You should sell the stock and open a new short position. In just two months, the price drops dramatically. When you see this kind of movement, it would be good to change from a monthly chart to a weekly or even daily one. With these kinds of moves you must take profits in the short term. As soon as there is a trendline break on the weekly or daily charts, you must take the profit. You would then wait for the downtrend line to be broken before taking any new action.
7. The downtrend line is broken in the second quarter of 1999. If you haven't done so already, you should close your short position and buy the stock again for a new, long one. After a big move down in a short time period, it will usually be difficult to draw a new trendline from the lowest point reached. The new uptrend line will have to start with one of the following bars or previous bars.
8. Beginning in 2001, the prices fall through the uptrend line. This means you close your long position and open a new, short position. Again, the sharp price drop means that you have to draw a faster declining downtrend line.
9. Prices move above the downtrend line beginning in 2002, so you close the short position and open a new, long one.
10. This uptrend line is broken in the second quarter of 2002. So you sell the stock and open a new short position. Again, the price drop is big and fast, which means it is time to take a profit again.
Would trading the trendline breaks as shown in Figure 1 have been
profitable? The results of trading long and short positions each time the
trendline was broken at the end of the month are displayed in Figure 2.
A starting equity of $1,000 would have become $10,110 after about 10
years. This is 10 times the starting capital or a compound interest rate
of more than 25% per year, which is not bad for looking at just one chart
once a month.
...Continued in the September issue of Technical Analysis of STOCKS
& COMMODITIES
Excerpted from an article originally published in the September 2007
issue of Technical Analysis of STOCKS & COMMODITIES magazine. All rights reserved. © Copyright
2007, Technical Analysis, Inc.
Return to September 2007 Contents