www.CHART-EX.com

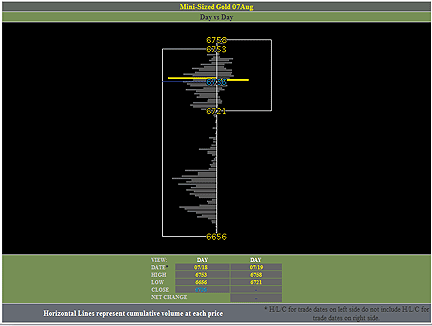
FIGURE 1: VOLUME AT PRICE CHART. Here you see the chart for the gold minicontracts. The horizontal bars represent volume at corresponding prices. You can see how at a glance where the high and low volume areas are.
Lisa Erdmier, president and cofounder of the Chart-Ex website, which
displays free commodity charts, developed a data visualization tool that
displays volume at price in a unique format. It is similar to the Market
Profile format in that it compares volume at price for one time frame to
another.
After spending several years as a floor trader, Erdmier wanted to develop a trading tool that would give the off-floor trader a picture of what goes on behind the numbers seen on a computer screen. The display, if you look at Figure 1, shows volume as histogram for a trading range of July 18 and 19 on the mini-gold contract. The horizontal lines represent volume for each corresponding price, which indicates where the high and low volume areas are at a glance.
On the home page you see thumbnails of these Java applet charts of various contracts traded on the CBOT and CME. If you click on any one of the applets you'll see a detailed description of the charts. From there you can link to charts of other contracts, or if you want to look at, say, the daily, weekly, and monthly charts of the soybean contracts, you can view all three at one time.
Those who are viewing the volume at price charts for the first time may find it beneficial to visit the tutorial section. For example, when I click on the soybean meal tutorial, I see the price at volume chart alongside the bar chart. There is an explanation of various points on both charts, so you can see the week's highs/lows, the day's highs/lows, and where the key resistance is. You get a sense of the areas where the price at volume chart has more advantages than the standard bar chart.
Other links on this site include articles written by Erdmier, an economic calendar, a discussion forum, and contract specs for various commodities.
The information on the site is valuable for any trader. The site, however, does have a Spartan appearance, with several ads by Google. Given that this type of charting holds a tremendous amount of value to any trader, I think traders would be more inclined to browse the site if it had a more sophisticated look and feel to it.
--Jayanthi Gopalakrishnan Editor
Chart-Ex
Return to Table of Contents