Access to foreign exchange trading has opened up exciting trading options for the retail trader. You can now trade alongside corporations and institutions in a highly liquid market that is global, traded around the clock, and highly leveraged. Before jumping into this market,
however, we must understand the factors that affect the forex market. With that in mind, STOCKS& COMMODITIES has introduced Forex Focus to better prepare the retail trader to participate in the currency market.
Surviving The Trappings Of Trends
Faced with a choppy trend? Here's how to analyze a trend and identify some realistic opportunities.
by Cornelius Luca
AH, the dream and promise of trends! Traders rightfully seek and try to follow them. However, staying with the trend is not for the faint-hearted, and unless you are Warren Buffett or have similarly deep pockets, you may not be able to survive the experience. The average trader will have to learn to shift between both short-term and medium-term strategies, and the long and short directions, regardless of the direction of the major trend.
Trends are sustained directions that last a minimum of five weeks or so, and a long-term trend will last more than a year. While buying near the lowest levels and selling near the top is always a nice fantasy, let's analyze a trend and identify some more realistic opportunities.
OPPORTUNITIES IN TRENDS
Figure 1 shows the euro/dollar pair rising between the middle of November 2005 to late May 2006. This medium-term uptrend was the initial rising leg of the trend that formed between November 15, 2006, and January 23, 2007, a pullback between January 24, 2007, and February 27, 2007, and the second rising leg between February 28, 2007, and May 15, 2007.
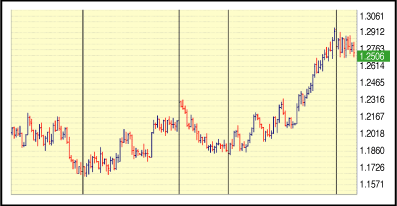
FIGURE 1: EURO/DOLLAR BETWEEN MID-NOVEMBER 2005 TO LATE May 2006. The euro/dollar is rising during this time period. You can see an initial rising leg, followed by a pullback, then a second rising leg.
Let's look at the first rising leg and identify possible entry points. Figure 2 displays the first leg of the uptrend. The green line marks the channel line and the red line shows the trendline, which I drew as a parallel to the channel line, at least on a temporary basis.
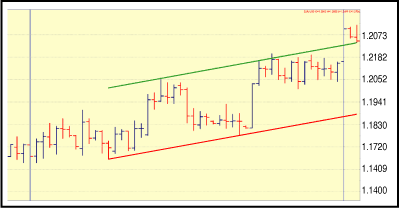
FIGURE 2: THE FIRST LEG OF THE UPTREND. The green line is the channel line and the red line represents the trendline.
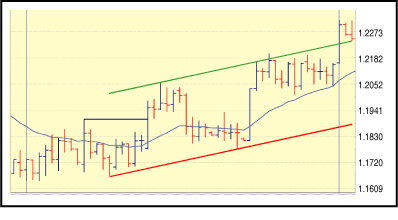
FIGURE 3: LACK OF MARKET COMMITMENT. You can see the lack of market commitment around the 20-day exponentially smoothed moving average in the first part of the first leg of the uptrend.
Let's assume you went long on a break above the blue line, which comes in at 1.1900. What can traders do from now on? First, decide on your stop-loss level, perhaps 0.5%, if you can afford to take a loss at or (more likely) below 1.1840. Second, decide on a profit-taking level, such as approximately 1% above the entry level, say at 1.2019. This simplistic approach assumes that you don't have any other technical levels to help your analysis, which should not be the case.
Once the market starts moving your way, make sure that you have your stop-loss order trailing the market. So if you still agree with the 0.5% amount, then apply further as the market continues to climb.
Let's assume you took profit on your long euro/dollar position at 1.2019 or better. See how after peaking at 1.2060 the pair fails to match this level, and also observe how far the price is relative to the 20-day moving average, a clear sign it's overbought. But since a currency can stay overbought for a long time, when should you sell for a countertrend deal? One suggestion is to sell on a breakout below a significant support, such as below the first of the three Fibonacci fan lines.
As you can see in Figure 4, I drew the Fibonacci fan lines off the coordinates of the uptrend between 1.1642 and 1.2060. The intersection between the price and the 38.2% Fibonacci fan level occurred at 1.1950, and this is a good level to sell. As of now, you would think that the euro/dollar will remain in an uptrend, so where should you leave the profit-taking order?
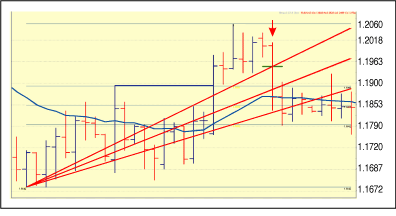
FIGURE 4: HELPFUL TECHNICAL TOOLS. A combination of Fibonacci fan lines, Fibonacci horizontal retracement levels, and a moving average should help you execute profitable countertrend trades.
KEY TECHNICAL LEVELS
In addition to this approach, let's take a look at some technical levels. Besides the fan lines, I also drew a standard set of Fibonacci retracement levels. The 38.2% horizontal line comes at 1.1900, coincidentally where the 50% Fibonacci rising fan line comes; that's the first target. But the euro/dollar remains under selling pressure, so hold on to your short position that you opened at around 1.1950. The second possible target to take profits is the 50% (middle) fan line at 1.1890. The third possible target comes from the 20-day moving average, which was at around 1.1870. It's only another 20 pips, but hey, it's 20 pips in your favor! The fourth possible target is 1.1851, where the 50% horizontal line lies.
Finally, you have another target, which is the last of the fan lines at 1.1833. The euro/dollar didn't quite make it that low, stopping that bearish day at 1.1838, so you should scoop up the currency quickly as the recovery will hurt your profits. Following these methods, you could have realized approximately 100 pips, minus brokerage fees.
After this episode, the euro/dollar traded mostly sideways with a strong break on the upside (see the blue arrow in Figure 5). Are there any realistic entry points? As you can see in Figure 5, one good buying opportunity would be on the break above the bottom fan line at 1.1910, but given previous unsuccessful breaks above this rising line, daytraders may be weary of holding their longs for more than a few minutes. However, the second break above 1.1955, which is marked by a declining resistance line, should have offered more encouragement to the euro/dollar bulls leading traders to buy.
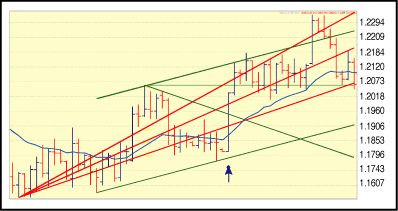
FIGURE 5: ENTRY AND EXIT POINTS. The break above the Fibonacci fan levels provide both entry and exit opportunities.
The last target for this trade comes from the parallel line that I drew to the rising trendline. If you follow this line, it came at 1.2143, precisely where euro/dollar formed a minor top. This outstanding result is only coincidental, but the target was generally accurate.
Following that burst on the upside, the euro/dollar pair entered a prolonged sideways market. Bide your time and trade in and out quickly on an intraday basis without committing yourself to directional trades for long. Then go for the breakout. This should be a quick transaction, and the motivation, at least the initial one, is to take advantage of the pent-up frustration during the low volatility period.
The euro/dollar spent 13 days in a range between 1.2006 and 1.2180. On the upside breakout you expect the pair to reach the same number of pips clocked during the sideways trading. So extrapolate 174 pips from 1.2180, but, as you can see from Figure 6, the pair never made it to 1.2354. The euro/dollar peaked at 1.2322. Based on the previous methods, traders should have taken profits on their long positions on a break below the top rising Fibonacci fan line at 1.2268.
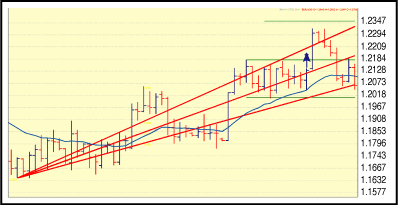
FIGURE 6: TRADING A BREAKOUT FROM A SIDEWAYS MARKET. Traders should have taken profits on their long positions on a break below the top rising Fibonacci fan line at 1.2268.
These are some of the methods traders could use to take advantage of choppy trends, particularly since they have apparently become more common in the past years.
Cornelius Luca is an author and analyst for Global Forex Trading and provides daily, weekly, and monthly commentary on the major foreign exchange markets.
SUGGESTED READING
Luca, Cornelius [2007]. Trading In The Global Currency Markets,
3d ed., Penguin Books.
_____ [2004]. Technical Analysis Applications, McGraw-Hill.
_____ [2000]. Technical Analysis Applications In The Global Currency
Markets, 2d ed., Penguin Books.
_____ [1997]. Introduction To Technical Analysis, Euromoney.
Return to October 2007 Contents
Originally published in the October 2007 issue of Technical Analysis
of STOCKS & COMMODITIES magazine. All rights reserved. © Copyright
2007, Technical Analysis, Inc.