A Daytrading Method Second To None
Forecasting Futures Movement
Is it possible to chase two rabbits at once? This intraday technique combines direction of price movement and timing of your entries and exits.
IN trading, two variables to consider are direction of price movement and the timing of your entries and exits. Most of the time you can't catch them both at the same time -- it's usually one or the other. In this article we show you how you can. We will discuss when and in which direction futures prices will move during an intraday period.
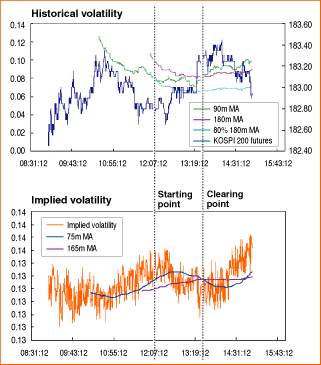
Empirically, we have found that when the 90-minute historical volatility goes below the 80% level of the 180-minute historical volatility, price tends to change drastically. At that point, the price is apt to increase if the 75-minute moving average of implied volatility is higher than the 165-minute moving average.
HISTORICAL VOLATILITY
Historical volatility (HV) is a powerful barometer of the drastic change of the underlying asset. If the value of HV is below normal, rapid changes can happen within a minute. However, historical volatility by itself does not tell us anything about the direction of the underlying asset's movement. Though many indicators claim to show direction and timing, they are not sufficient by themselves. This is because one indicator provides only one clue. You need at least two indicators to provide two independent clues. Here we will show you how you can get information for two clues using two indicators -- historical volatility (HV) and implied volatility (IV).
PREDICTING VOLATILITY
Many previous researches revealed that the relative level of short-term historical volatility (HVS) to long-term historical volatility (HVL) works well at predicting volatility. For example, a 1996 article in Technical Analysis of STOCKS & COMMODITIES by Laurence A. Connors and Linda Bradford Raschke introduced the NR4 indicator, a pattern that indicates a jump in the underlying the next trading day. Theoretically, the Standard & Poor's 500 is apt to change drastically after the NR4 sign, which indicates the one-week historical volatility reading is less than half of the 100-day historical volatility reading.
Besides NR4, many ideas use the historical volatility to predict the movement of the change in the underlying asset. Though they are helpful in timing entries, they do not provide information on the direction of future movement.
We applied basic logic using historical volatility and created an entry timing technique for intraday trading. We also improved the forecasting power of the change in the underlying asset by using implied volatility. Thus, historical volatility was used to predict adequate timing when volatility is expected to increase and implied volatility was used to predict the direction of change by using the mean reversion property of implied volatility.
We conducted the analysis on the Kospi 200 index futures of KRX (Korea Exchange). Kospi 200 futures is an index futures contract with a minimum 0.05-point change. The change of one point in an index equals to 500,000 won (US$538). Kospi 200 index futures is the fifth-largest futures index in the world and the volume of Kospi 200 index options market is the largest. In addition to the size of the market, the Kospi 200 futures market attracts many investors interested in dynamic but stable investments in Asia.

FIGURE 1: A LONG ENTRY SIGNAL. The entry signal is generated when the HVS (green) line meets the 80% of HVL (blue) line. At this point the IVS (dark blue line on lower graph) is higher than the IVL (pink line). This indicates you should open a long position. You would exit the position when the IVS and IVL lines meet again.
...Continued in the December issue of Technical Analysis of STOCKS
& COMMODITIES
Excerpted from an article originally published in the December 2007 issue of Technical Analysis of STOCKS & COMMODITIES magazine. All rights reserved. © Copyright
2007, Technical Analysis, Inc.
Return to December 2007 Contents