Regression And R-Squared, Together Again
Confirming Price Trend
by Barbara Star, PhD
Here's a technique using linear regression slope and r-squared to confirm the price trend.
Linear regression is a statistical method some traders use to filter the static, or "noise," created by day-to-day or bar-to-bar price movements. Using the least-squares method, it minimizes the amount of deviation among price values to determine a best-fit line. In an earlier STOCKS & COMMODITIES article, I showed that applying a linear regression indicator to price creates less lag and more trading opportunities than a moving average of the same length.
As useful as the linear regression indicator is for detecting price shifts, two other outputs derived from a linear regression may hold equal value for traders. In this article I will introduce two lesser-known indicators, r-squared and linear regression slope, which can serve as useful adjuncts when determining price trend and price direction.
R-SQUARED
R-squared is a measure of association. It measures the proportion of explained variation between the linear regression and the underlying data it is tracking. For traders that means the r-squared calculation identifies how closely the linear regression indicator matches the underlying price movement; the higher the r-squared value, the greater the correlation with the trending component of price. The eSignal code can be found in sidebar 1, "eSignal code for r-squared."
The length of lookback parameter chosen plays a role in determining the numeric level at which r-squared assumes a positive correlation with the underlying linear regression and price movement at the statistical 95% confidence level; the shorter the r-squared length, the higher the r-squared level needed. For instance, a 10-period r-squared reaches a positive correlation at the 0.40 level, while a 50-period only needs to exceed a 0.08 level.
While there is no standard default parameter for the r-squared length in trading, it should correspond to the underlying linear regression length. I find that a 20- to 30-period r-squared indicator works well for end-of-day trading purposes. The 20-period r-squared, which reaches a positive correlation at 0.20, will be used throughout the examples in this article.
R-squared moves on a scale of zero to 1.0. A rising r-squared indicates strength of association with a price that is trending, while declining r-squared readings suggest a weak or weakening correlation between linear regression and price.
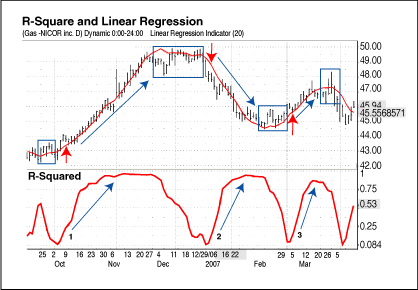
The price chart of Nicor in Figure 1 contains an overlay of a 20-period
linear regression on price and a 20-period r-squared indicator in the bottom
panel. The red arrows on the price chart show when the rising r-squared
indicator reached or slightly exceeded the 0.20 levels.

FIGURE 1: R-SQUARED WITH NICOR. The top panel is a chart of Nicor. The bottom panel contains a 20-period r-squared indicator. The arrows show the direction of price movement that corresponds to the rising r-squared and the rectangles identify price movement during a falling r-squared.
In general, when r-squared rises from a low level (for example, zero, 0.01, or 0.02), it serves as an alert that price may be entering or resuming a trending condition. On the Nicor chart, the blue arrows on the indicator following points 1, 2, and 3 show a rising r-squared. However, as the arrows on the price chart also illustrate, a rising r-squared does not necessarily correspond to rising prices. From the low levels at 1 and 3 the indicator rose as did price, but this was not the case at point 2, when a rising r-squared was followed by falling prices.
...Continued in the December issue of Technical Analysis of STOCKS
& COMMODITIES
Excerpted from an article originally published in the December 2007
issue of Technical Analysis of
STOCKS & COMMODITIES magazine. All rights reserved. © Copyright
2007, Technical Analysis, Inc.
Return to December 2007 Contents