A Fast And Reliable Trigger
Short-Term Trading With SVAPO
In this, the second part of this series, we will look at how to apply the short-term volume and price oscillator, otherwise known as SVAPO.
The trading rules I will discuss here are based on an eight-bar short-term volume and price oscillator (SVAPO) period with a 1/1,000 minimum price change and with an upper standard deviation channel at 1.5 and 1.3 at the lower side over a 100-day period, as discussed in my previous article. The rules are:
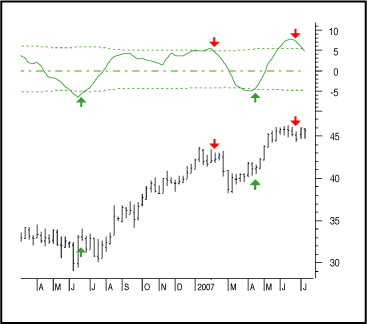
Rule 1: The start of a short-term up move is signaled
when SVAPO turns up from below the lower standard deviation boundary as
in the weekly chart of Hewlett-Packard (HP) in Figure 1. The same is valid
for a short-term down move when Svapo turns down from above the upper standard
deviation boundary.

FIGURE 1: CHANGE IN TREND. Here you see the HP weekly chart illustrating rule 1 with SVAPO entries and exits.
Rule 2: Medium-term turning points in an uptrend or downtrend are usually indicated with a divergence between price and SVAPO. See the divergence (1) at the end of April in Figure 2. The SVAPO has higher lows while price has lower lows. At the end of the medium-term uptrend at (3), another divergence appears with lower highs in SVAPO and higher highs in price.
Rule 3: In a medium-term uptrend, SVAPO will generally continue to move above the zero-reference line. Look at reference (2) in Figure 2. In a medium-term downtrend, SVAPO will generally continue to move below the zero-reference line.
Rule 4: For short-term scalping or finding additional
medium-term entry points, SVAPO can be used with a period of only three
bars and no minimum price change. Look at the different entry points on
the chart of Pfizer in Figure 3 indicated by SVAPO at the start and during
the medium-term uptrend. Note how each entry point is a profitable short-term
trade on its own. The medium-term turning point is reached when SVAPO passes
the upper boundary and diverges by the end of May.
...Continued in the December issue of Technical Analysis of STOCKS
& COMMODITIES
Excerpted from an article originally published in the December 2007
issue of Technical Analysis of
STOCKS & COMMODITIES magazine. All rights reserved. © Copyright
2007, Technical Analysis, Inc.
Return to December 2007 Contents