Here is this month's selection of Traders' Tips, contributed by various developers of technical analysis software to help readers more easily implement some of the strategies presented in this and other issues.
December 2007
TRADERS' TIPSYou can copy these formulas and programs for easy use in your spreadsheet or analysis software. Simply "select" the desired text by highlighting as you would in any word processing program, then use your standard key command for copy or choose "copy" from the browser menu. The copied text can then be "pasted" into any open spreadsheet or other software by selecting an insertion point and executing a paste command. By toggling back and forth between an application window and the open Web page, data can be transferred with ease.
This month's tips include formulas and programs for:
TRADESTATION: CONFIRMING PRICE TREND
eSIGNAL: CONFIRMING PRICE TREND
METASTOCK: CONFIRMING PRICE TREND
WEALTH-LAB: CONFIRMING PRICE TREND
NEUROSHELL TRADER: CONFIRMING PRICE TREND
AMIBROKER: CONFIRMING PRICE TREND
STRATASEARCH: CONFIRMING PRICE TREND
WORDEN BROTHERS BLOCKS: CONFIRMING PRICE TREND
ASPEN GRAPHICS WORKSTATION 4.2: CONFIRMING PRICE TREND
TRADINGSOLUTIONS: CONFIRMING PRICE TREND
TRADECISION: CONFIRMING PRICE TREND
TRADE NAVIGATOR: CONFIRMING PRICE TREND
ENSIGN SOFTWARE: CONFIRMING PRICE TREND
NINJATRADER: CONFIRMING PRICE TREND
VT TRADER: CONFIRMING PRICE TREND
SWINGTRADER: CONFIRMING PRICE TREND
TD AMERITRADE STRATEGYDESK: CONFIRMING PRICE TRENDor return to December 2007 Contents
TRADESTATION: CONFIRMING PRICE TREND
Barbara Star's article in this issue, "Confirming Price Trend," describes the use of linear regression, linear regression slope, and the square of Pearson's product-moment correlation coefficient (r-squared) for confirming price trends. All three of these statistical calculations are available in the TradeStation platform and can be found in the EasyLanguage function library. The functions are called LinearRegValue, LinearRegSlope and RSquare.
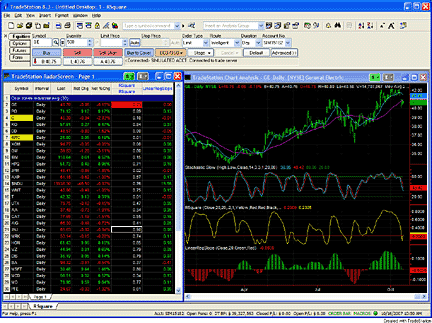
FIGURE 1: TRADESTATION, R-SQUARED, LINEAR REGRESSION SLOPE, AND STOCHASTICS. Here, the TradeStation indicators RSquared and Lin Regression Slope are applied to a daily chart of GE and to a RadarScreen window containing all of the Dow Jones Industrial stocks. The chart includes a two-line moving average and stochastics, matching the charts in Barbara Star's article in this issue.The following indicator code calls these functions and displays the calculated values. The Lin Regression Slope indicator will change color when the slope crosses zero. The RSquared indicator includes an alert that is triggered when the r-squared calculation rises above a user-specified level. The alert remains in effect for a user-specified number of bars. In RadarScreen, the cell background color is changed when the alert condition is true.To download the EasyLanguage code for these studies, go to the Support Center at TradeStation.com and search for the file "RSquared.Eld." TradeStation does not endorse or recommend any particular strategy.
Indicator: Lin Regression Slope--Mark Mills
inputs:
Price ( Close ),
Length( 20 ),
UpLineColor( Green ),
DnLineColor( Red ) ;variables:
LRS( 0 ) ;LRS = LinearRegSlope( Price, Length ) ;
Plot1( LRS, "LRS" ) ;if LRS > 0 then
SetPlotColor( 1, UpLineColor )
else
SetPlotColor( 1, DnLineColor ) ;Indicator: RSquared
inputs:
Price( Close ),
LinearRegLength( 20 ),
RSquaredLength( 20 ),
Threshold( 0.2 ),
AlertBarLength( 1 ),
ChartRSquaredColor( Yellow ),
ChartThreshLineColor( Red ),
RadarAlertBGColor( Red ),
RadarAlertTextColor( Black ),
RadarNoAlertBGColor( Black ) ,
RadarNoAlertTextColor( White ) ;variables:
ApplicationType( 0 ),
AlertBarNum( 0 ),
LinRegVal( 0 ),
RSquared( 0 ) ;if CurrentBar = 1 then
ApplicationType = GetAppInfo( aiApplicationType ) ;LinRegVal = LinearRegValue( Price, LinearRegLength,0 ) ;
RSquared = RSquare( Price, LinRegVal, RSquaredLength ) ;Plot1( Threshold, "R^2Trig" ) ;
Plot2( RSquared, "R^2" ) ;if RSquared crosses over Threshold then
AlertBarNum = CurrentBar ;if ApplicationType = cRadarScreen then
begin
if CurrentBar < AlertBarNum + AlertBarLength then
begin
SetPlotBGColor( 2, RadarAlertBGColor ) ;
SetPlotColor ( 2, RadarAlertTextColor ) ;
Alert( "RSquared crossing up through " + "threshold level." ) ;
end
else
begin
SetPlotBGColor( 2, RadarNoAlertBGColor ) ;
SetPlotColor ( 2, RadarNoAlertTextColor ) ;
end ;
end
else
begin
SetPlotColor( 1, ChartThreshLineColor ) ;
SetPlotColor( 2, ChartRSquaredColor ) ;
end ;
TradeStation Securities, Inc.
A subsidiary of TradeStation Group, Inc.
www.TradeStation.com
eSIGNAL: CONFIRMING PRICE TREND
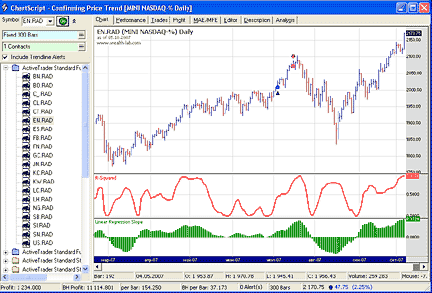
In "Confirming Price Trend" by Barbara Star in this issue, the eSignal formula code for r-squared.efs and LinReg_Slope.efs was already included in the article's sidebars. In addition to these two sets of code, we've also provided our own version of the LinearRegressionIndicator.efs, which was used in Star's chart examples. The study contains a formula parameter that may be configured through the Edit Studies option in the Advanced Chart to change the number of periods.
To discuss the related studies or download complete copies of the formulas, please visit the EFS Library Discussion Board forum under the Forums link at www.esignalcentral.com or visit our EFS KnowledgeBase at https://www.esignalcentral.com/support/kb/efs/.
The eSignal formula scripts (EFS) can also be downloaded here:
Click to download:A sample chart is shown in Figure 2.Linear Regression Indicator
Linear Regression Slope
R-Squared
FIGURE 2: eSIGNAL, LINEAR REGRESSION INDICATOR/*********************************
Provided By:
eSignal (Copyright © eSignal), a division of Interactive Data
Corporation. 2007. All rights reserved. This sample eSignal
Formula Script (EFS) is for educational purposes only and may be
modified and saved under a new file name. eSignal is not responsible
for the functionality once modified. eSignal reserves the right
to modify and overwrite this EFS file with each new release.Description: Linear Regression Indicator
Parameters: Default:
Periods 20
**********************************/function preMain() {
setPriceStudy(true);
setStudyTitle("Linear Regression Indicator");
setCursorLabelName("LR", 0);
setDefaultBarFgColor(Color.red, 0);
setDefaultBarThickness(2, 0);var fp1 = new FunctionParameter("nLength", FunctionParameter.NUMBER);
fp1.setName("Periods");
fp1.setLowerLimit(1);
fp1.setDefault(20);
}var bInit = false;
var xLR = null;function main(nLength) {
if (bInit == false) {
xLR = efsInternal("calcLR", nLength);
bInit = true;
}
var nLR = xLR.getValue(0);
return nLR;
}function calcLR(nLen) {
// y = Ax + B;
// A = SUM( (x-xAVG)*(y-yAVG) ) / SUM( (x-xAVG)^2 )
// A = slope
// B = yAVG - (A*xAVG);if (close(-(nLen-1)) != null) {
var xSum = 0;
var ySum = 0;
var i = 0;
for (i = 0; i < nLen; i++) {
xSum += i;
ySum += close(-i);
}var xAvg = xSum/nLen;
var yAvg = ySum/nLen;
var aSum1 = 0;
var aSum2 = 0;
i = 0;
for (i = 0; i < nLen; i++) {
aSum1 += (i-xAvg) * (close(-i)-yAvg);
aSum2 += (i-xAvg)*(i-xAvg);
}
var A = (aSum1 / aSum2);
var B = yAvg - (A*xAvg);
}return B;
}
/*****************************************************************
Provided By : eSignal. (c) Copyright 2004
Study: R-Squared
Version: 1.011/5/2006
Formula Parameters: Defaults:
Periods 8
Thickness 2
Color red
Display Line
Upper Band 0.75
Lower Band 0.20
*****************************************************************/function preMain() {
setStudyTitle("R-Squared ");
setCursorLabelName("R-Squared", 0);
setDefaultBarFgColor(Color.red, 0);
setDefaultBarThickness(2, 0);
setShowTitleParameters(false);var fp10 = new FunctionParameter("nLRlen", FunctionParameter.NUMBER);
fp10.setName("Periods");
fp10.setLowerLimit(1);
fp10.setDefault(8);var fp20 = new FunctionParameter("nLRThickness", FunctionParameter.NUMBER);
fp20.setName("Thickness");
fp20.setLowerLimit(1);
fp20.setDefault(2);var fp30 = new FunctionParameter("nLRColor", FunctionParameter.COLOR);
fp30.setName("Color");
fp30.setDefault(Color.red);
var fp40 = new FunctionParameter("sDisplay", FunctionParameter.STRING);
fp40.setName("Display");
fp40.addOption("Line");
fp40.addOption("Histogram");
fp40.setDefault("Line");
var fp50 = new FunctionParameter("nUpper", FunctionParameter.NUMBER);
fp50.setName("Upper Band");
fp50.setDefault(0.75);
var fp60 = new FunctionParameter("nLower", FunctionParameter.NUMBER);
fp60.setName("Lower Band");
fp60.setDefault(0.2);}
var bInit = false;
var xClose = null;
var xLinReg = null;function main(nLRlen, nLRThickness, nLRColor, sDisplay, nUpper, nLower) {
if (bInit == false) {
setDefaultBarThickness(nLRThickness, 0);
setDefaultBarFgColor(nLRColor, 0);
if (sDisplay == "Histogram") {
setPlotType(PLOTTYPE_HISTOGRAM, 0);
} else {
setPlotType(PLOTTYPE_LINE, 0);
}
addBand(nUpper, PS_SOLID, 1, Color.blue, "upperBand");
addBand(nLower, PS_SOLID, 1, Color.blue, "lowerBand");
xClose = close();
xLinReg = efsInternal("LinReg", nLRlen, xClose);
bInit = true;
}if (xLinReg.getValue(0) != null) {
var A = getSeries(xLinReg, 0); // Slope
var B = getSeries(xLinReg, 1); // y-intercept
var R = getSeries(xLinReg, 2); // R-Squared
}return R;
}function LinReg(nLRlen, x) {
if (x.getValue(-nLRlen) == null) return;var xSum = 0;
var ySum = 0;
var sumXY = 0;
var sumX2 = 0;
var sumY2 = 0;
i = 0;
for (i = 0; i < nLRlen; ++i) {
var xVal = x.getValue(-i);
xSum += (i+1);
ySum += xVal;
sumXY += ((i+1) * xVal);
sumX2 += ((i+1) * (i+1));
sumY2 += (xVal * xVal);
}
var xAvg = xSum/nLRlen;
var yAvg = ySum/nLRlen;
var aSum1 = 0;
var aSum2 = 0;
i = 0;
for (i = 0; i < nLRlen; ++i) {
aSum1 += (i-xAvg) * (x.getValue(-i)-yAvg);
aSum2 += (i-xAvg)*(i-xAvg);
}// y = Ax + B;
// A = SUM( (x-xAVG)*(y-yAVG) ) / SUM( (x-xAVG)^2 )
// A = slope
// B = yAVG - (A*xAVG);
// B = y-intercept
// R2 = r-squared or correlation coefficientvar A = (aSum1 / aSum2);
var B = yAvg - (A*xAvg);
var R2 = Math.pow( (nLRlen * sumXY - xSum * ySum) /
Math.sqrt( (nLRlen*sumX2- (xSum*xSum)) *
(nLRlen*sumY2 - (ySum*ySum)) ) , 2);return new Array(A, B, R2);
}
/*****************************************************************
Provided By : eSignal. (c) Copyright 2004
Study: Linear Regression Slope
Version: 1.011/5/2006
Formula Parameters: Defaults:
Periods 8
Thickness 2
Color blue
Display Line
*****************************************************************/function preMain() {
setStudyTitle("Linear Regression Slope ");
setCursorLabelName("Slope", 0);
setDefaultBarFgColor(Color.blue, 0);
setDefaultBarThickness(2, 0);
setShowTitleParameters(false);var fp10 = new FunctionParameter("nLRlen", FunctionParameter.NUMBER);
fp10.setName("Periods");
fp10.setLowerLimit(1);
fp10.setDefault(8);var fp20 = new FunctionParameter("nLRThickness", FunctionParameter.NUMBER);
fp20.setName("Thickness");
fp20.setLowerLimit(1);
fp20.setDefault(2);var fp30 = new FunctionParameter("nLRColor", FunctionParameter.COLOR);
fp30.setName("Color");
fp30.setDefault(Color.blue);
var fp40 = new FunctionParameter("sDisplay", FunctionParameter.STRING);
fp40.setName("Display");
fp40.addOption("Line");
fp40.addOption("Histogram");
fp40.setDefault("Line");
}var bInit = false;
var xClose = null;
var xLinReg = null;function main(nLRlen, nLRThickness, nLRColor, sDisplay) {
if (bInit == false) {
setDefaultBarThickness(nLRThickness, 0);
setDefaultBarFgColor(nLRColor, 0);
if (sDisplay == "Histogram") {
setPlotType(PLOTTYPE_HISTOGRAM, 0);
} else {
setPlotType(PLOTTYPE_LINE, 0);
}
xClose = close();
xLinReg = efsInternal("LinReg", nLRlen, xClose);
bInit = true;
}if (xLinReg.getValue(0) != null) {
var A = getSeries(xLinReg, 0); // Slope
var B = getSeries(xLinReg, 1); // y-intercept
var R = getSeries(xLinReg, 2); // R-Squared
}return A;
}function LinReg(nLRlen, x) {
if (x.getValue(-nLRlen) == null) return;var xSum = 0;
var ySum = 0;
var sumXY = 0;
var sumX2 = 0;
var sumY2 = 0;
i = 0;
for (i = 0; i < nLRlen; ++i) {
var xVal = x.getValue(-i);
xSum += (i+1);
ySum += xVal;
sumXY += ((i+1) * xVal);
sumX2 += ((i+1) * (i+1));
sumY2 += (xVal * xVal);
}
var xAvg = xSum/nLRlen;
var yAvg = ySum/nLRlen;
var aSum1 = 0;
var aSum2 = 0;
i = 0;
for (i = 0; i < nLRlen; ++i) {
aSum1 += (i-xAvg) * (x.getValue(-i)-yAvg);
aSum2 += (i-xAvg)*(i-xAvg);
}// y = Ax + B;
// A = SUM( (x-xAVG)*(y-yAVG) ) / SUM( (x-xAVG)^2 )
// A = slope
// B = yAVG - (A*xAVG);
// B = y-intercept
// R2 = r-squared or correlation coefficientvar A = (aSum1 / aSum2);
var B = yAvg - (A*xAvg);
var R2 = Math.pow( (nLRlen * sumXY - xSum * ySum) /
Math.sqrt( (nLRlen*sumX2- (xSum*xSum)) *
(nLRlen*sumY2 - (ySum*ySum)) ) , 2);return new Array(-A, B, R2);
}
--Jason Keck
eSignal, a division of Interactive Data Corp.
800 815-8256, www.esignalcentral.com
METASTOCK: CONFIRMING PRICE TREND
Barbara Star's article in this issue, "Confirming Price Trend," discusses using r-squared and the slope of a linear regression line in conjunction with moving averages and the stochastic. All these indicators are built into MetaStock and require no custom formula to use. Here is a system based on the suggestions in her article.
Long positions are entered when:
-A 10-period moving average is above a 30-period moving averageShort positions are entered when:
-The stochastic oscillator has risen above 20
-R-squared is above 0.2
-A 20-period linear regression line slope is above zero.-A 10-period moving average is below a 30-period moving averagePositions are closed when:
-The stochastic oscillator has fallen below 80
-R-squared is above 0.2
-A 20-period linear regression line slope is below zero.-R-squared is equal to 0.2 or lessThe formulas and the steps to recreate this system in MetaStock are shown here:
-A 20-period linear regression lines slopes against the position
-Either the moving averages or the stochastic oscillator give an opposing signal.1. Select Tools > the Enhanced System Tester--William Golson
2. Click "New"
3. Enter a name
4. Select the Buy Order tab and enter the following formula:stsig:=if(cross(stoch(14,3),20),1,if(cross(80,stoch(14,3)),-1,prev);5. Select the Sell Order tab and enter the following formula:
mov(c,10,S)>mov(c,30,s) AND rsquared(c,20)>.2 AND
LinRegSlope(c,20)>0 AND stsig=1stsig:=if(cross(stoch(14,3),20),1,if(cross(80,stoch(14,3)),-1,prev);6. Select the Sell Short Order tab and enter the following formula:
rsquared(c,20)<=.2 AND LinRegSlope(c,20)<=0 AND
(stsig=-1 OR mov(c,10,S)<mov(c,30,s))stsig:=if(cross(stoch(14,3),20),1,if(cross(80,stoch(14,3)),-1,prev);7. Select the Buy to Cover Order tab and enter the following formula:
mov(c,10,S)<mov(c,30,s) AND rsquared(c,20)>.2 AND
LinRegSlope(c,20)<0 AND stsig=-1stsig:=if(cross(stoch(14,3),20),1,if(cross(80,stoch(14,3)),-1,prev);8. Click OK to close the system editor.
rsquared(c,20)<=.2 AND LinRegSlope(c,20)>=0 AND
(stsig=1 OR mov(c,10,S)>mov(c,30,s))
MetaStock Support Representative
Equis International (A Reuters Company)
801 265-9998, www.metastock.com
WEALTH-LAB: CONFIRMING PRICE TREND
The Wealth-Lab code sample provided here implements one of the ideas outlined in Barbara Star's article in this issue ("Confirming Price Trend"): combining the r-squared and the linear regression slope to build a promising entry filter.
The rising r-squared indicator is detected by its upturn from a low value to a threshold level of positive correlation, which is used in the article, over a trading week. If this condition is present and the slope is positive, we then buy on strength or short on weakness with a vanilla channel-breakout entry. We exit either if the r-squared becomes overdone or after 20 days in the trade (Figure 3).
FIGURE 3: WEALTH-LAB, FILTERING ENTRIES WITH R-SQUARED AND THE LINEAR REGRESSION SLOPE. Exit if the r-squared becomes overdone or after 20 days in the trade.
WealthScript code:
// Period used throughout the article--Eugene
var period: integer = 20;{ Plotting }
var Bar, LinRegSlopePane, RSquaredPane, LinearRegSlope1, RSquared1: integer;
RSquaredPane := CreatePane( 75, false, true );
LinRegSlopePane := CreatePane( 75, false, true );
RSquared1 := RSquaredSeries( #Close, period );
LinearRegSlope1 := LinearRegSlopeSeries( #Close, period );
PlotSeriesLabel( RSquared1, RSquaredPane, 900, #Thick, 'R-Squared' );
PlotSeriesLabel( LinearRegSlope1, LinRegSlopePane, 050, #ThickHist, 'Linear Regression Slope' );
HideVolume;// How many days did the upturn take
var lookback: integer = 5;InstallTimeBasedExit( 20 );
for Bar := (period+lookback) to BarCount-1 do
begin
ApplyAutoStops( Bar );
if LastPositionActive then
// Exit when r-squared is overdone
begin
if ( @RSquared1[Bar] > 0.7 ) then
SellAtMarket( Bar+1, LastPosition, '');
end
else
// r-squared + LR slope based entry filter
begin
if ( @RSquared1[Bar] > 0.2 ) and ( @RSquared1[Bar-lookback] < 0.02 ) then
if ( @LinearRegSlope1[Bar] > 0 ) then
BuyAtStop( Bar+1, Highest( Bar, #High, 40 ), '' ) else
ShortAtStop( Bar+1, Lowest( Bar, #Low, 40 ), '' );
end;
end;
www.wealth-lab.com
NEUROSHELL TRADER: CONFIRMING PRICE TREND
The indicators and strategy described by Barbara Star in her article in this issue, "Confirming Price Trend," can be implemented in NeuroShell Trader by using a few of NeuroShell Trader's 800+ indicators. To plot the indicators described in the article on a chart, select "New Indicator ..." from the Insert menu and use the Indicator Wizard to create the following indicators:
LinTimeReg Rsqd ( Close, 20 )To recreate a trading strategy like the one described in Star's article, select "New Trading Strategy ..." from the Insert menu and enter the following entry and exit conditions in the appropriate locations of the Trading Strategy Wizard:
LinTimeReg Slope ( Close, 20 )
MovAvg ( Close, 10 )
MovAvg ( Close, 30 )
Stoch%K ( High, Low, Close, 14 )Generate a buy long MARKET order if ALL of the following are true:If you have NeuroShell Trader Professional, you can also choose whether the system parameters should be optimized. After backtesting the trading strategy, use the "Detailed Analysis ..." button to view the backtest and trade-by-trade statistics for the "Confirming Price Trend" strategy.Generate a protective stop:A>B( MovAvg(Close,10), MovAvg(Close,30) )
A>B( Stoch%K (High,Low,Close,14), 80 )
A>B( Momentum(LinTimeReg Slope(Close,20), 1), 0)
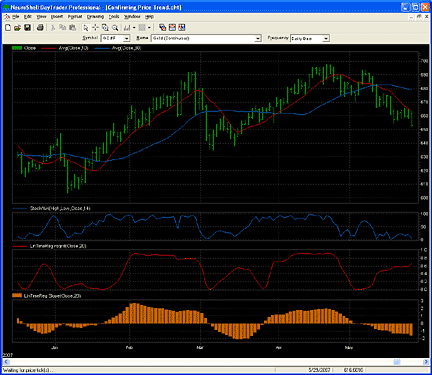
CrossAbove( LinTimeReg Rsqd(Close,20), 0.2 )MovAvg ( Close, 30 )For more information on NeuroShell Trader, visit https://www.NeuroShell.com.
--Marge Sherald, Ward Systems Group, Inc.
301 662-7950, sales@wardsystems.com
www.neuroshell.com
FIGURE 4: NEUROSHELL TRADER, LINEAR REGRESSION SLOPE AND R-SQUAREDGO BACK
AMIBROKER: CONFIRMING PRICE TREND
In "Confirming Price Trend" in this issue, author Barbara Star discusses analysis techniques based on r-squared and linear regression slope indicators. The linear regression slope is AmiBroker's built-in function. The r-square indicator can be implemented as single-line function in AFL.
Ready-to-use formulas for the linear regression slope chart and r-square indicator chart can be found in listings 1 and 2 below. To use them, simply open the AFL Editor window, type in the formula, and press the "Apply Indicator" button.
A sample AmiBroker chart is shown in Figure 5.
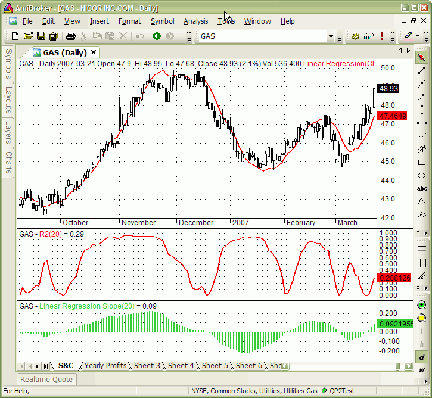
FIGURE 5: AMIBROKER, R-SQUARED AND LINEAR REGRESSION SLOPE. A NICOR daily price chart is shown in the upper pane, with r-squared in the middle pane, and linear regression slope in the lower pane.
LISTING 1
Periods = Param("Periods", 20, 2, 200, 1, 10 );
Plot( LinRegSlope( C, Periods ), "LinRegSlope("+Periods+")",
colorGreen, styleHistogram | styleThick );LISTING 2
function RSquared( array, periods )
{
return Correlation( BarIndex(), array, periods ) ^ 2;
}periods = Param("Periods", 20, 2, 100 );
Plot( RSquared( C, periods ), "R2(" + periods + ")", colorRed, styleThick );
--Tomasz Janeczko, AmiBroker.com
www.amibroker.com
STRATASEARCH: CONFIRMING PRICE TREND
R-squared and linear regression slope aren't new indicators. In fact, traders have been using them for many years; however, in her article in this issue, "Confirming Price Trend," author Barbara Star brings us something new by showing us how these indicators can be used together to increase their potential benefit. (See Figure 6.)
As the author suggests, there are numerous ways the indicators can be evaluated together, but in our tests, some of the most helpful benefits came from evaluating divergences. We first used an automated search to evaluate the benefits of divergences when used with a variety of other indicators such as stochastics, TRIX, and price rate-of-change. By not entering positions when the indicators were diverging, we were frequently able to improve our returns. As well, there was often some benefit to exiting positions when the indicators began diverging, although this led to significantly shorter holding periods for many systems.
R-squared and linear regression slope are already a part of the standard StrataSearch indicator library, and there are a number of trading rules already available that explore their capabilities in an automated search. However, we've also created some new trading rules based on the author's suggestions that StrataSearch users may find helpful.
As with all our other StrataSearch Traders' Tips contributions, a plug-in containing the code for these trading rules can be downloaded from the Shared Area of our User Forum. Simply install the plug-in, start your search, and let StrataSearch identify whether these new trading rules can improve your trading systems.
//****************************************************************
// R-Squared
//****************************************************************
rsq(CLOSE, 20)//****************************************************************
// Linear Regression Slope
//****************************************************************
lrs(CLOSE, 20)
--Pete RastGO BACK
Avarin Systems, Inc.
www.StrataSearch.com
WORDEN BROTHERS BLOCKS SOFTWARE: CONFIRMING PRICE TREND
To use the studies described here, you will need the free Blocks software and the Strategy Trader data pack. Go to https://www.Blocks.com to download the software and get detailed information on the available data packs.
In the article by Barbara Star in this issue, "Confirming Price Trend," she uses linear regression, r-squared, linear regression slope, and stochastics as confirming indicators of the current trend.
Each of these indicators (studies) is available in the Blocks library. No custom coding is required.
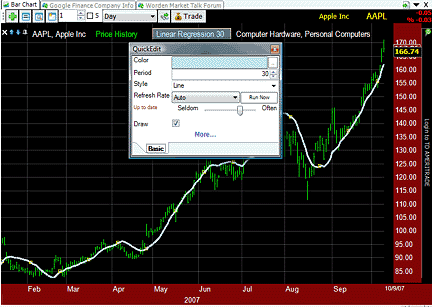
Open the Personal Chartist workspace in Blocks, then click the Add Study button () and type "linear regression" to filter the list and select the linear regression study. You can edit the parameters of the linear regression line by clicking on its name in the legend and using the QuickEdit menu:
Follow the same procedure to add linear regression slope, r-squared and stochastics. Use the QuickEdit menus on each of these studies to customize the settings and parameters (Figure 7).
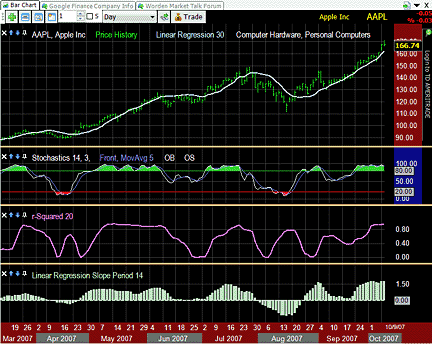
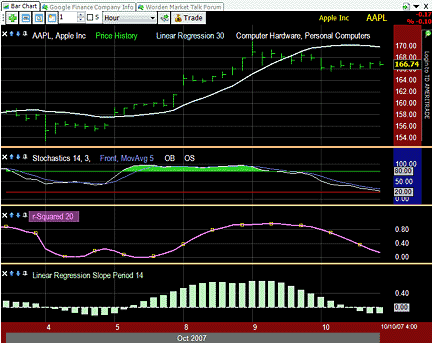
FIGURE 7: BLOCKS, R-SQUARED AND LINEAR REGRESSION SLOPE. Here is a daily chart of AAPL.These indicators can be used for any time frame. Just click the time frame selector at the top of the chart to view daily charts, three-day charts, weekly charts, and so on. With the Mega Minute pack, you can also view intraday charts (minute, hourly, and so on) with streaming real-time data. Figure 8 shows the same indicators on an hourly chart of AAPL, which can be used to measure shorter-term trends.
FIGURE 8: BLOCKS, R-SQUARED AND LINEAR REGRESSION SLOPE. Here is an hourly chart of AAPL.To download the Blocks analysis software, go to https://www.Blocks.com. Then, to choose your Blocks Analysis Packs, call 800 776-4940, or order online at the Blocks website.--Bruce Loebrich and Patrick ArgoGO BACK
Worden Brothers, Inc.
www.blocks.com, www.worden.com
ASPEN GRAPHICS Workstation 4.2: CONFIRMING PRICE TREND
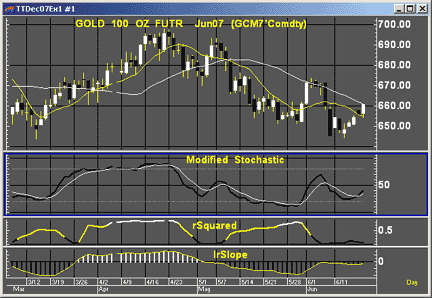
Barbara Star's r-squared and linear regression slope systems presented in her article in this issue, "Confirming Price Trend," can be easily replicated using Aspen Graphics Workstation 4.2.Figure 9 illustrates a system very similar to Star's multiple indicator system, consisting of candlesticks, stochastics, dual moving averages, the r-squared indicator, and the linear regression slope indicator. Note that both the r-squared and linear regression slope indicators have an Aspen Color Rule applied to them. This allows traders to quickly identify trend status using color coding.
FIGURE 9: ASPEN GRAPHICS, CONFIRMING THE TREND. This sample chart displays candlesticks, stochastics, dual moving averages, the r-squared indicator, and the linear regression slope indicator. Both the r-squared and linear regression slope indicators have an Aspen Color Rule applied to them to help identify trend status.Star's system can be broken down into two mathematical formulas: one to create the r-squared line and one to create the linear regression slope. Aspen users may download a complete Aspen Page Suite for Star's system at ftp://ftp.aspenres.com/TradersTips/Trader Tip Dec 07.zip.For a free trial of Aspen Graphics, please contact Aspen sales at 800 359-1121 or sales@aspenres.com. Aspen users who need assistance in implementing Star's system may contact Aspen technical support at 970 945-2921 or support@aspenres.com.
--Jeremiah AdamsGO BACK
Aspen Graphics Technical Support
Aspen Research Group, Ltd.
970 945-2921, support@aspenres.com
www.aspenres.com
TRADINGSOLUTIONS: LINEAR REGRESSION AND R-SQUARED
In "Confirming Price Trend," Barbara Star discusses ways to use the linear regression r-squared and linear regression slope indicators.
rSquared(series, periods = 20) = beginBoth of these indicators are included in the "Statistical Functions" group of functions in TradingSolutions. As with many indicators, these functions can make good inputs not only to rule-based systems, but also to neural network predictions.
retval = 0
xsum = 0
ysum = 0
sumxy = 0
sumx2 = 0
sumy2 = 0
xval = 0
xavg = 0
yavg = 0
asum1 = 0
asum2 = 0
prod = 0
val = 0
i = 0while i <periods do begin
xval = $1[i]
xsum = xsum + ( i + 1 )
ysum = ysum + xval
sumxy = sumxy + ( (i + 1) * xval )
sumx2 = sumx2 + ( (i + 1) * (i + 1) )
sumy2 = sumy2 + ( xval * xval )
i = i + 1
endxavg = xsum / periods
yavg = ysum / periodsprod = (periods * sumxy - xsum * ysum) / sqrt( (periods * sumx2 - (xsum
* xsum) ) * ( periods * sumy2 - (ysum * ysum) ) )retval = prod * prod
retval
endlrSlope(series, periods = 20) = begin
retval = 0
xsum = 0
ysum = 0
sumxy = 0
sumx2 = 0
sumy2 = 0
asum1 = 0
asum2 = 0
xavg = 0
yavg = 0
slope = 0
i = 0while i < periods do begin
xval = $1[i]
xsum = xsum + (i + 1)
ysum = ysum + xval
i = i + 1
endxavg = xsum / periods
yavg = ysum / periodsi = 0
while i < periods do begin
xval = $1[i]
asum1 = asum1 + ( (i - xavg) * (xval - yavg) )
asum2 = asum2 + ( (i - xavg) * (i - xavg) )
i = i + 1
endslope = (asum1 / asum2) * -1
retval = slope
retval
end
--Gary GeniesseGO BACK
NeuroDimension, Inc.
800 634-3327, 352 377-5144
www.tradingsolutions.com
TRADECISION: LINEAR REGRESSION SLOPE AND R-SQUARED
"Confirming Price Trend" by Barbara Star demonstrates a technique for using the linear regression slope and r-squared indicators for determining price trend and price direction.
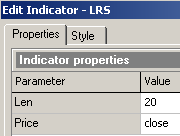
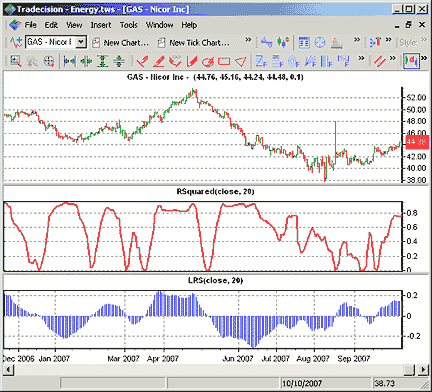
Tradecision comes with the built-in RSquared and LRS indicators, which can be easily inserted in a chart without any coding (Figure 10). The default settings of both indicators can be modified with a few clicks:
FIGURE 10: TRADECISION, R-SQUARED AND LINEAR REGRESSION SLOPE. R-squared and LRS are applied to a Nicor daily chart.To use these indicators, open the Tradecision application, and from the Insert menu, select the corresponding indicator and then click "Insert."GO BACK
--Alex Grechanowski
Alyuda Research, Inc.
sales@tradecision.com, 510 931-7808
www.tradecision.com
TRADE NAVIGATOR: R-SQUARED AND REGRESSION OSCILLATOR
The linear regression line helps filter out the static or noise in price charts. Barbara Star's article in this issue, "Confirming Price Trend," combines the use of linear regression with the r-squared indicator. Both of these can become valuable tools in your trading toolbox.
Both indicators are already built into Trade Navigator Gold and Platinum. They are called "regression oscillator" and "RSquared."
To add the regression oscillator to the chart, click on the Charts menu and select "Add to Chart." Next, click on the indicators tab. Scroll down to find the regression oscillator in the list, then click on it and click Add.
To overlay the regression oscillator over the price bars on a chart, drag the text "regression oscillator" from the lower chart pane to the upper chart pane.
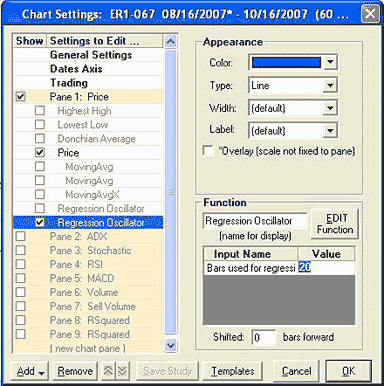
To set the regression oscillator to 20 bars as used in the article, right-click on the name "regression oscillator" and choose Edit. Type "20" into the Input Value and click OK:
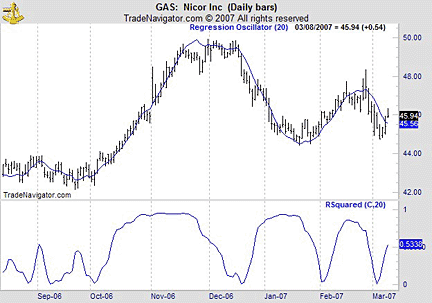
To add r-squared to the chart, follow the same steps, but don't drag it to a different pane so that RSquared remains in its own pane. Change the default input bars to 20.Your chart should now display both indicators, as demonstrated in Figure 11.
--Dave KilmanGO BACK
Genesis Financial Technologies, Inc.
www.genesisft.com FIGURE 11: TRADE NAVIGATOR, R-SQUARED AND LINEAR REGRESSION. Here is a sample chart of r-squared and the regression oscillator.
ENSIGN WINDOWS: CONFIRMING PRICE TREND
In "Confirming Price Trend" in this issue, Barbara Star demonstrates how to combine linear regression slope and r-squared to help confirm price trends. The studies and analysis presented in Star's "Confirming Price Trend" article are easily accomplished in Ensign Windows.
The linear regression indicator, linear regression slope, and r-squared studies are built into the Ensign Windows program. No special programming language script is required. Here's how to configure the study properties to accomplish the example shown in Figure 12.
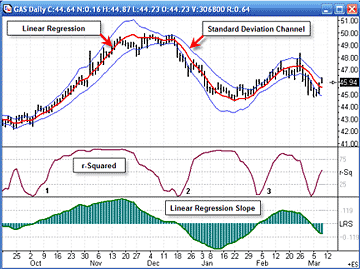
FIGURE 12: ENSIGN WINDOWS. Here is a daily chart of NICOR, Inc., with the linear regression indicator, r-squared, and linear regression slope.From the list of studies in Ensign Windows, add the regression channel study to a chart and configure its parameters, as shown here:
This will implement the linear regression indicator shown in Figure 12, and throws in the added benefit of a channel based on standard deviation.Add a second copy of the regression channel study to a chart and configure its properties as shown in the window below to implement the r-squared study as demonstrated in the first subwindow in Figure 12.
Add a third copy of the regression channel study to the chart and configure its properties as shown in the window below to display the linear regression slope study using a histogram. All three regression channel studies use the same 20-bars parameter.
A free trial of Ensign Windows is downloadable from https://www.ensignsoftware.com for an evaluation period.--Howard Arrington, Ensign SoftwareGO BACK
www.ensignsoftware.com
NINJA TRADER: CONFIRMING PRICE TREND
The r-squared and linear regression slope indicators, as discussed in "Confirming Price Trend" by Barbara Star in this issue, are available for download at https://www.ninjatrader.com/SC/December2007SC.zip.
Once the indicators are downloaded, from within the NinjaTrader Control Center window, select the menu File > Utilities > Import NinjaScript and select the downloaded file.
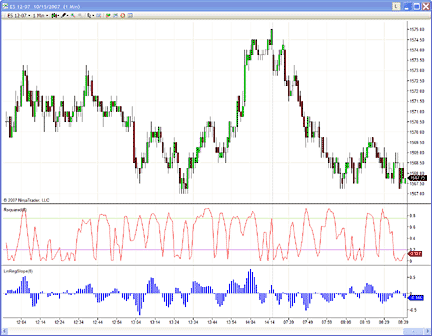
You can review the indicator's source code by selecting the menu Tools > Edit NinjaScript > Indicator from within the NinjaTrader Control Center window and selecting either the r-squared or LinRegSlope indicators. See Figure 13.
FIGURE 13: NINJATRADER, R-SQUARED AND LINEAR REGRESSION SLOPE. This NinjaTrader screenshot shows both the r-squared and linear regression slope indicators on a one-minute S&P Emini December 2007 chart.
NinjaScript indicators are compiled DLLs that run native, not interpreted, which provides you with the highest performance possible.--Raymond Deux and Joshua PengGO BACK
NinjaTrader, LLC
www.ninjatrader.com
VT TRADER: R-SQUARED AND LINEAR REGRESSION SLOPE
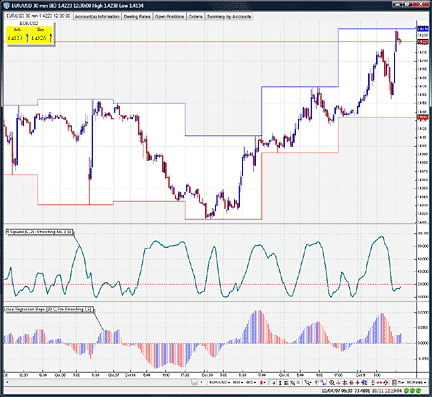
Barbara Star's article in this issue, "Confirming Price Trend," discusses the use of the r-squared and linear regression slope indicators to measure the correlation between price and its linear regression (strength of the trend) and to help determine the direction of the price movement. Star goes on to discuss how these two indicators can be used in conjunction with moving average crosses and the stochastic oscillator to help qualify potential trade entry and exit points.
The linear regression slope indicator is included with VT Trader as a standard indicator; however, we'll be offering a modified version of the r-squared indicator for download in our user forums. Our modified version adjusts the r-squared scale from zero to 1 and zero to 100 and includes the option to apply smoothing to its plot.
The VT Trader code and instructions for setting up our modified version of the r-squared indicator are as follows.
1. Navigator Window>Tools>Indicator Builder>[New] buttonTo attach the r-squared indicator to a chart, click the right mouse button within the chart window and then select "Add Indicators" -> "R-Squared" from the indicator list. A sample chart is shown in Figure 14.2. In the Indicator Bookmark, type the following text for each field:
Name: R-Squared3. In the Input Bookmark, create the following variables:
Short Name: vt_R2
Label Mask: R-Squared (%price%, %periods% | Smoothing: %smoothing:ls%, %SmoothingPeriods%, %SmoothingType%)
Placement: New Frame
Inspect Alias: R-Squared[New] button... Name: Price , Display Name: Price , Type: price , Default: Close4. In the Output Bookmark, create the following variables:
[New] button... Name: Periods , Display Name: Periods , Type: integer , Default: 14
[New] button... Name: Smoothing , Display Name: Enable Smoothing? , Type: Enumeration , Default: No; *Select […] button, [New] button, type Yes option, [New] button, type No option, Select [OK] button
[New] button... Name: SmoothingPeriods , Display Name: Smoothing Periods , Type: integer , Default: 14
[New] button... Name: SmoothingType , Display Name: Smoothing Type , Type: MA Type , Default: Simple[New] button...5. In the Horizontal Line Bookmark, create the following variables:
Var Name: R
Name: (R-Squared)
Line Color: dark green
Line Width: slightly thicker
Line Type: solid line[New] button...6. In the Formula Bookmark, copy and paste the following formula:
Value: +20.0000
Color: red
Width: thin
Style: dashed line{Provided By: Visual Trading Systems, LLC & Capital Market Services, LLC (c) Copyright 2007}7. Click the "Save" icon to finish building the r-squared indicator.
{Description: R-Squared indicator}
{Notes: TASC, December 2007 - Regression and R-Squared, Together Again - Confirming Price Action}
{vt_R2 Version 1.0}{Correlation function}
t1:= BarCount();
t2:= price;N:= periods;
A:= (N * Sum(Power(t1,2),N) - Power(Sum(t1,N),2));
B:= (N * Sum(Power(t2,2),N) - Power(Sum(t2,N),2));
R1:= (N * Sum(t1*t2,N) - Sum(t1,N) * Sum(t2,N)) / (sqrt(A) * sqrt(B));{R-Squared Indicator}
R2:= Power(R1,2) * 100;
SmoothedR2:= mov(R2, SmoothingPeriods, SmoothingType);
R:= If(smoothing=0, R2, SmoothedR2);
FIGURE 14: VT TRADER. The r-squared and linear regression slope indicators are displayed below the EUR/USD 30-minute candle chart.To learn more about VT Trader, visit www.cmsfx.com.--Chris Skidmore, CMS ForexGO BACK
866 51-CMSFX, trading@cmsfx.com
www.cmsfx.com
SWINGTRADER: Confirming Price Trend
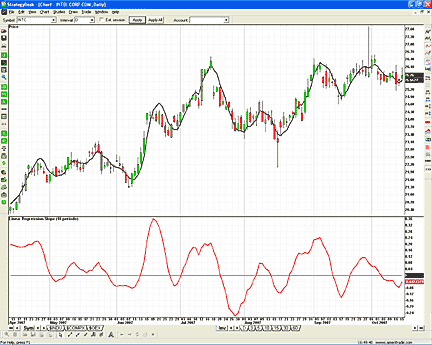
The r-squared indicator has now been introduced in SwingTracker 5.13. A sample chart plotting it is shown in Figure 15. The preference settings are shown here:
FIGURE 15: SWINGTRADER, R-SQUAREDTo discuss this tool, please visit our forum at forum.mrswing.com, or visit support.mrswing.com for support. For more information on a free trial, visit www.swingtracker.com.
/*
* RsquaredIndicator.java
*/package com.iqpartners.data.indicator;
import com.iqpartners.chart.render.HistogramDSRenderer;
import com.iqpartners.chart.render.LineDSRenderer;
import com.iqpartners.chart.render.RangeRenderer;
import com.iqpartners.chart.render.RendererContext;
import com.iqpartners.data.ChartInfo;
import com.iqpartners.data.ChartItemInfo;
import com.iqpartners.data.DataSet;
import com.iqpartners.data.Range;
import com.iqpartners.data.overlay.ColorParameter;
import com.iqpartners.data.overlay.IntegerParameter;
import com.iqpartners.data.overlay.ParameterComponent;
import com.iqpartners.data.overlay.SpinnerIntegerComponent;
import com.iqpartners.main.ColorPicker;
import com.iqpartners.main.ColorSchemeManager;
import com.iqpartners.main.TranslatedMessages;
import com.iqpartners.util.EasyLanguageUtil;
import com.iqpartners.util.StringUtil;
import java.awt.Color;
import java.awt.Graphics;
import java.util.ResourceBundle;public class RsquaredIndicator extends Indicator
{
public RsquaredIndicator()
{}
private static final int[] labelPercentages = { 0, 25, 50, 75, 100 };
private static final LabelWriter labelWriter = new LabelWriter ()
{
public String getLabel (float value)
{
return StringUtil.formatFloat2D (value);
}
};
private static final int[] gridPercentages = { 25, 50, 75 };protected void setParameters ()
{
// Initiliaze localization
ResourceBundle messages;
TranslatedMessages translatedMessages = TranslatedMessages.instance ();
messages = translatedMessages.getBundle ();IntegerParameter ip1 = new IntegerParameter (messages.getString ("length"), 20)
{
public ParameterComponent getParameterComponent ()
{
return new SpinnerIntegerComponent (this, 1, 100, 1);
}
};
addParameter (INT_PARM_1, ip1);
ColorParameter cp1 = new ColorParameter (messages.getString ("rsquare_color"), null);
addParameter (COLOR_PARM_1, cp1);
setRangeRenderer (new RangeRenderer ()
{
public void plot (RendererContext rc, Range r, Graphics g)
{
drawPercentageLabels (g, rc, r, labelPercentages, labelWriter);
drawPercentageGrid (g, rc, r, gridPercentages);
drawTitle (g, rc, getOverlayName ());
drawLastLabel (g,rc);
}
});
}private int length()
{
return getIntParm (INT_PARM_1, 20);
}protected void calculate()
{
clearDataSets ();
if ((chartData != null) && ! chartData.isEmpty() )
{
DataSet ds_linRegSlope = new DataSet( chartData);
Float[] close = DataSet.Close (chartData).getAllData();for ( int i = 0; i < close.length; i++ )
{
float reg = EasyLanguageUtil.rSquared(close, length(), 0, i);
ds_linRegSlope.addFloat(reg);
}ds_linRegSlope.setDataSetRenderer(new LineDSRenderer(new ColorPicker()
{
public Color getColor (int index)
{
return getColorParm (
COLOR_PARM_1, ColorSchemeManager.current ().color2 ());
}
}));
addDataSetPair (DS_1, ds_linRegSlope, null);
calculateRange();
}
}public ChartInfo getInfoEx (int index)
{
ChartInfo ci = new ChartInfo ();
// initiliaze localization
ResourceBundle messages;
TranslatedMessages translatedMessages = TranslatedMessages.instance ();
messages = translatedMessages.getBundle ();
DataSet atr = getDataSet1 (DS_1);
if (atr != null)
{
Float value = atr.dataAt (index);
if (value != null)
{
ChartItemInfo cii = new ChartItemInfo ();
cii.setName (messages.getString ("rsquare"));
cii.setValue (StringUtil.formatFloat2D (value.floatValue ()));
cii.setColor (getColorParm (COLOR_PARM_1, ColorSchemeManager.current ().color2 ()));
ci.add (cii);
}
}
return ci;
}public String getOverlayName()
{
ResourceBundle messages;
TranslatedMessages translatedMessages = TranslatedMessages.instance ();
messages = translatedMessages.getBundle ();
return messages.getString ("rsquare_indicator");
}}
GO BACK--Larry Swing
281 968-2718, theboss@mrswing.com
www.swingtracker.com
TD AMERITRADE StrategyDesk: Confirming Price Trend
This month, we'll look at the formula for linear regression and the linear regression slope as discussed by Barbara Star in her article in this issue, "Confirming Price Trend."
Due to the extensive calculations required to build the r-squared indicator, it will not be discussed here. The regression formula (ax + b) and our work to build the formula are shown at the end of this tip for those who would like to extrapolate it for different lengths.
Linear Regression (10 days): (100*Bar[Close,D] + 90*Bar[Close,D,1] + 80*Bar[Close,D,2] + 70*Bar[Close,D,3] + 60*Bar[Close,D,4] + 50*Bar[Close,D,5] + 40*Bar[Close,D,6] + 30*Bar[Close,D,7] + 20*Bar[Close,D,8] + 10*Bar[Close,D,9] - 550 * MovingAverage[MA,Close,10,0,D]) / 825 * 10 +These formulas can be used to incorporate these indicators into a backtest or program trade, or they can be used to create custom studies. Here is a depiction of each of these on a chart (Figure 16). The linear regression is overlaid on the stock chart in the top pane, while the linear regression slope is depicted as an indicator in the lower pane.
MovingAverage[MA,Close,10,0,D] - (10*Bar[Close,D] + 9*Bar[Close,D,1] + 8*Bar[Close,D,2] + 7*Bar[Close,D,3] + 6*Bar[Close,D,4] + 5*Bar[Close,D,5] + 4*Bar[Close,D,6] + 3*Bar[Close,D,7] + 2*Bar[Close,D,8] + Bar[Close,D,9] - 55 * MovingAverage[MA,Close,10,0,D]) / 825 * 55Linear Regression Slope (10 days): (100*Bar[Close,D] + 90*Bar[Close,D,1] + 80*Bar[Close,D,2] + 70*Bar[Close,D,3] + 60*Bar[Close,D,4] + 50*Bar[Close,D,5] + 40*Bar[Close,D,6] + 30*Bar[Close,D,7] + 20*Bar[Close,D,8] + 10*Bar[Close,D,9] - 550 * MovingAverage[MA,Close,10,0,D]) / 825
FIGURE 16: TD AMERITRADE, R-SQUARED AND LINEAR REGRESSION SLOPE. The linear regression is overlaid on the price chart in the top pane, while the linear regression slope is depicted as an indicator in the lower pane.
As noted, here is the detail for the formulas above:n = 10If you have questions about this formula or functionality, please call TD Ameritrade's StrategyDesk helpline at 800 228-8056, or access the Help Center via the StrategyDesk application. StrategyDesk is a downloadable application free for all TD Ameritrade clients. Regular commission rates apply.
_x = 1 + 2 + 3 + 4 + 5 + 6 + 7 + 8 + 9 + 10 = 55
_y = 10 * MovingAverage[MA,Close,10,0,D]
_xy = 10*Bar[Close,D] + 9*Bar[Close,D,1] + 8*Bar[Close,D,2] + 7*Bar[Close,D,3] + 6*Bar[Close,D,4] + 5*Bar[Close,D,5] + 4*Bar[Close,D,6] + 3*Bar[Close,D,7] + 2*Bar[Close,D,8] + Bar[Close,D,9]
_x2 = 1 + 4 + 9 + 16 + 25 + 36 + 49 + 64 + 81 + 100 = 385Linear Regression = ax + b
a = (n*_xy - _x*_y) / (n*_x2 - _x*_x)
a = (10 * (10*Bar[Close,D] + 9*Bar[Close,D,1] + 8*Bar[Close,D,2] + 7*Bar[Close,D,3] + 6*Bar[Close,D,4] + 5*Bar[Close,D,5] + 4*Bar[Close,D,6] + 3*Bar[Close,D,7] + 2*Bar[Close,D,8] + Bar[Close,D,9]) - 55 * 10 * MovingAverage[MA,Close,10,0,D]) / (10 * 385 - 55 * 55)
a = Slope = (100*Bar[Close,D] + 90*Bar[Close,D,1] + 80*Bar[Close,D,2] + 70*Bar[Close,D,3] + 60*Bar[Close,D,4] + 50*Bar[Close,D,5] + 40*Bar[Close,D,6] + 30*Bar[Close,D,7] + 20*Bar[Close,D,8] + 10*Bar[Close,D,9] - 550 * MovingAverage[MA,Close,10,0,D]) / 825b = (_y - a_x) / n
b = (10 * MovingAverage[MA,Close,10,0,D] - ((100*Bar[Close,D] + 90*Bar[Close,D,1] + 80*Bar[Close,D,2] + 70*Bar[Close,D,3] + 60*Bar[Close,D,4] + 50*Bar[Close,D,5] + 40*Bar[Close,D,6] + 30*Bar[Close,D,7] + 20*Bar[Close,D,8] + 10*Bar[Close,D,9] - 550 * MovingAverage[MA,Close,10,0,D]) / 825) * 55) / 10
b = MovingAverage[MA,Close,10,0,D] - (10*Bar[Close,D] + 9*Bar[Close,D,1] + 8*Bar[Close,D,2] + 7*Bar[Close,D,3] + 6*Bar[Close,D,4] + 5*Bar[Close,D,5] + 4*Bar[Close,D,6] + 3*Bar[Close,D,7] + 2*Bar[Close,D,8] + Bar[Close,D,9] - 55 * MovingAverage[MA,Close,10,0,D]) / 825 * 55
TD Ameritrade and StrategyDesk do not endorse or recommend any particular trading strategy.
--Jeff AndersonGO BACK
TD AMERITRADE Holding Corp.
www.tdameritrade.com
Return to December 2007 Contents
Originally published in the September 2007 issue of Technical Analysis of STOCKS & COMMODITIES magazine. All rights reserved. © Copyright 2007, Technical Analysis, Inc.