Using Summary Statistics, In Over 60 Years
What Works, What Doesn't In Stock Market History
And here for your education and edification, Standard & Poor's 500 summary statistics from January 1945 to May 2007! Some factors are strongly correlated with rising or falling markets. Find out what they are, in part 1 of a two-part series.
IN trading, as in poker, it pays to know the odds. Although the Standard & Poor's 500 is far from predictable, certain factors are strongly correlated with rising or falling markets. There is no guarantee that these relationships will continue, but comprehending 60 years of stock market history helps us understand when we're holding a full house or a low pair. In this article, I'll summarize and update an overview of several factors that over the years continue to influence stock market returns — earnings and dividend yield; interest rates; and seasonality, including month of year and the Presidential election cycle.
THE S&P ITSELF: DESCRIPTION STATISTICS
Before searching for extraordinary subsequent periods of S&P 500
performance, it is best to first define “ordinary." To do this you must
know the range of values in the S&P 500 historically. Since the variable
of interest in this article will be the 12-month percentage change, I will
start by examining all rolling (overlapping) 12-month S&P 500 percentage
changes (excluding dividends) to get a feel for what “normal" is (Figure
1).
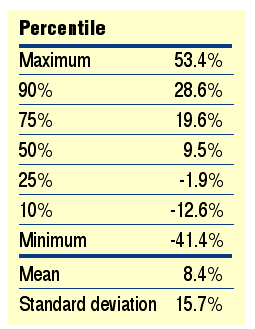
FIGURE 1: 12-MONTH % CHANGE IN THE S&P 500 BY PERCENTILE, 1945-MAY 2007, EXCLUDING DIVIDENDS (ALL ROLLING 12-MONTH PERIODS), n = 734. This gives you an idea of what is considered normal behavior of the S&P 500.
Over the past 62 years (as of this writing), the S&P 500 gained an average 8.4% per year. The biggest 12-month gain was 53.4%. The greatest decline was 41.4%; 50% of the time, the market rose 9.5% or more. Only 25% of the time did it rise greater than 19.6%, and only 10% of the time did it rise more than 28.6%. It is reassuring to note that 75% of the time the market's performance was better than -1.9%.
Note that the standard deviation of market returns was 15.7%, but this statistic should be used with caution since it implies a normal distribution. If market returns were normally distributed, then the 41.4% maximum 12-month decline should occur only once every 110.8 years, but it occurred in our 62-year sample; this should give us an idea of how fat the tails (or extreme ends) of our distribution are.
Now that we have some sense of what "normal" is, let's see if we can find which variables have historically been associated with "abnormal" subsequent returns. In all of the studies presented here, I will start with what was known (the independent variable) and then measure how the market performed over the next 12 months (the dependent variable). When doing these historical explorations, it is important to ensure that only information known at the time is used as the independent variable and that the dependent variable does not contain the independent variable in its calculation.
When studying the January effect — the propensity of stocks to rise
for the year following an up January — it is important to calculate the
return from the end of January to the close of the year, since the magnitude
of January's close would not have been known until February, and this would
be the entry point of an investor or trader attempting to exploit this
relationship.
...Continued in the January issue of Technical Analysis of STOCKS
& COMMODITIES
Excerpted from an article originally published in the January 2008
issue of Technical Analysis of STOCKS & COMMODITIES magazine. All rights reserved. © Copyright
2007, Technical Analysis, Inc.
Return to January 2008 Contents
